Projects
📂 Recent Projects
· Bayesian Spatial Analysis of Bike-share Data for Cyclist Speed Zone Prediction in Austin, Texas
📆 Jan. 2025 – Apr. 2025
Summary:
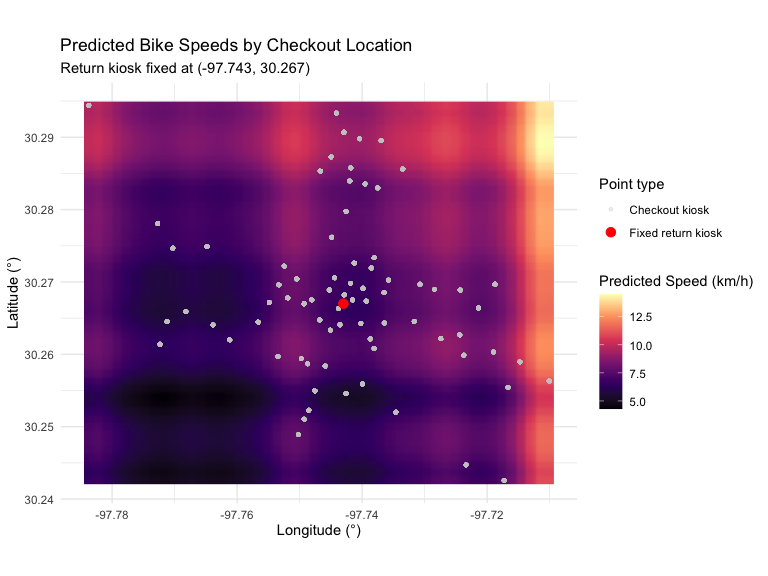
This project applies Bayesian hierarchical modeling to predict average cyclist speeds in Austin’s MetroBike network. Using two City of Austin datasets — MetroBike Trips and MetroBike Kiosk Locations — the study integrates spatial coordinates of checkout and return kiosks to generate a continuous “speed map” across the city. By identifying high and low average speed zones, the model highlights potentially hazardous or congested routes for cyclists and provides actionable insights for urban mobility planning.
Keywords:
Bayesian Statistics, Spatial Modeling, Shared Mobility, Urban Safety
Tools:
• Dataset: Austin MetroBike Trips, Austin MetroBike Kiosk Locations
– 100,000 sampled trips (2019 subset)
– Excluded staff rebalancing trips and durations > 250 minutes
• Software: R (+ JAGS), Python
Methodology:
- Data Collection & Wrangling: Combined the MetroBike trip data with kiosk locations to geocode checkout and return coordinates. Filtered unrealistic trip durations and missing records, and standardized the dataset for Bayesian modeling.
- Modeling: Implemented a Bayesian Generalized Additive Model (GAM) and a Hierarchical Poisson Regression model using JAGS. Each kiosk’s longitude and latitude were encoded with Gaussian basis functions to capture spatial variability across Austin.
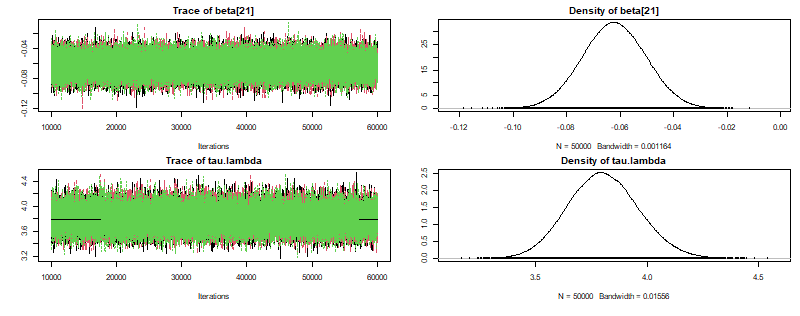
- Prior Settings: Used weakly informative priors — β ∼ N(0, 100²I), τ ∼ Gamma(0.1, 0.1) — to allow data-driven posterior inference.
- Computation: Conducted 50,000 MCMC iterations with 10,000 burn-in samples; convergence verified via Gelman-Rubin diagnostics.
Results:
The Bayesian GAM produced realistic spatial predictions of cyclist speed patterns, showing slower travel in downtown and denser urban areas. While the Poisson regression achieved better predictive accuracy for trip durations, the GAM effectively visualized spatial dependencies, forming the basis for city-scale risk mapping.
Future Work:
Refine the model with multimodal likelihoods to capture heterogeneous riding behaviors and integrate environmental covariates (e.g., elevation, weather, or time-of-day effects). Future versions will explore Gaussian Process or deep Bayesian models for more flexible spatial inference.
· Weekly Traffic Flow Prediction using SARIMA: A Case Study of the Lamar–Manchaca Intersection in Austin, Texas
📆 Aug. 2024 – Dec. 2024
Summary:
This project analyzes short-term traffic flow patterns at the Lamar–Manchaca intersection in Austin using a Seasonal Autoregressive Integrated Moving Average (SARIMA) model. By applying 15-minute interval radar data from the City of Austin Open Data Portal, the study successfully forecasts one week of traffic volume trends, identifying recurring daily and weekly traffic patterns and peak-hour behaviors.
Keywords:
Traffic Forecasting, Time-Series Analysis, SARIMA, Urban Mobility, Austin Transportation
Tools:
• Dataset: Radar Traffic Counts
– 15-minute interval traffic counts
– 4 directional flows: NB_in, NB_out, SB_in, SB_out
– Training: Sept 2020 (30 days)
– Testing: Oct 2020 (7 days)
• Software: Python, Excel
Methodology:
- Data Cleaning: Identified and corrected missing and duplicate records at non-15-minute intervals. Missing data were imputed using one-week-apart values to preserve weekly periodicity.
- Exploratory Analysis: Quantified variability and central tendencies for each traffic direction; identified SB_in as the most volatile direction.
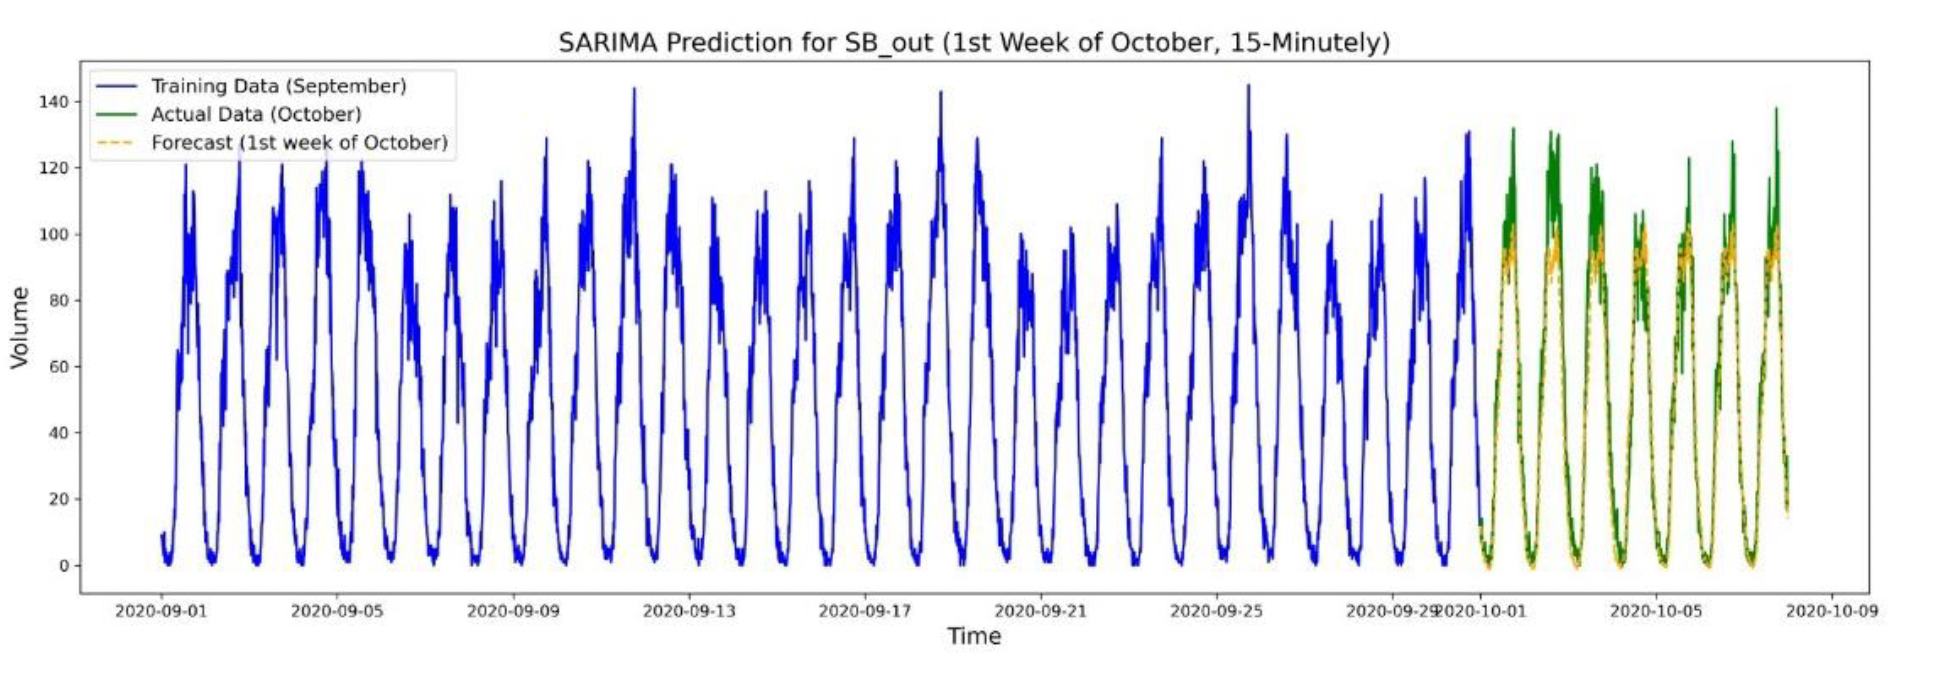
- Modeling: Implemented SARIMA with parameters (p,d,q) = (1,1,1) and (P,D,Q,m) = (1,1,1,96) to capture both daily and weekly cycles.
- Evaluation: Forecasted Oct 1–7, 2020 traffic volumes and validated using Mean Squared Error (MSE ≤ variance criterion). All four traffic directions met this condition.
Results:
SARIMA effectively modeled diurnal and weekly patterns, achieving low prediction errors (e.g., SB_out MSE = 129.52 < variance = 1634.33). The model demonstrated strong generalization for consistent flow directions, highlighting SARIMA’s applicability for real-time congestion prediction.
Future Work:
Integrate external factors (weather, events, holidays) and explore hybrid or deep learning approaches (e.g., LSTM, Prophet) to capture non-linear and irregular patterns for more adaptive traffic forecasting.
· Optimal Sites and Scale Selection for Micro Fulfillment Center (MFC) Construction in Seoul, Korea
ARE5009. Adventure Design II | Hanyang University
📆 Aug. 2022 – Dec. 2022
Summary:
This project proposes MES (Mobility–Energy–Shopping), a future-ready urban infrastructure that transforms underutilized gas station sites in Seoul into vertically integrated Micro Fulfillment Centers (MFCs) combined with EV charging stations. Using public datasets—including population density, parcel area, delivery volume, and the spatial distribution of gas stations—the study identifies optimal sites and determines the required MFC scale for each location. Through data-driven spatial analysis and algorithmic modeling, the project presents a new typology for urban logistics and electric-mobility infrastructure in high-density cities.
Keywords:
EV Charging Infrastructure, Micro Fulfillment Center, Urban Logistics, Gas Station Reuse, Data-Driven Spatial Design
Tools:
• Software: QGIS, Rhino 3D & Grasshopper (C# Scripting)
• Data: Public datasets on population, delivery volume, parcel areas, and all 472 gas station locations in Seoul
Methodology:
Data Collection: Compiled public data from Seoul Open Data Portal, including population by district, parcel sizes, delivery volume distribution, and gas station coordinates.
Spatial Analysis:
– Mapped gas station distribution and removed 39 irregular outliers for stable analysis.
– Performed district-level comparison of population, parcel density, and delivery demand.
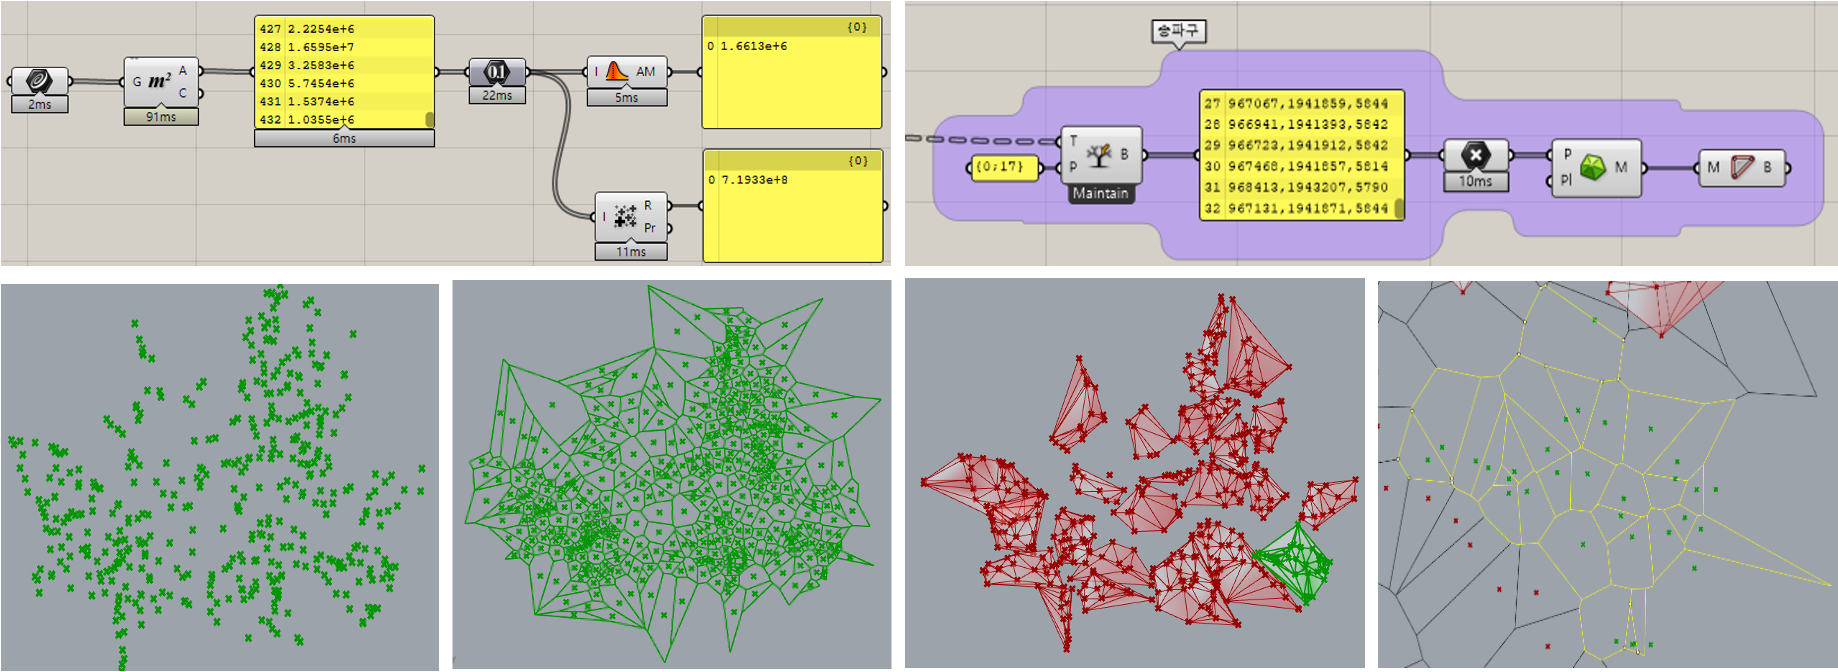
Parametric Modeling (Rhino 3D & Grasshopper):
– Modeled each station’s parcel geometry, land coverage, and floor-area ratio constraints.
– Computed buildable volume and feasible vertical MFC capacity.
Algorithmic Modeling:
– Applied Voronoi spatial division to compute each station’s service territory.
– Used custom C# scripts in Grasshopper to allocate required MFC area as weighted by service area, delivery volume, and parcel size.
– Ranked and selected optimal sites (e.g., Gangnam-gu, Songpa-gu) based on aggregated scores.
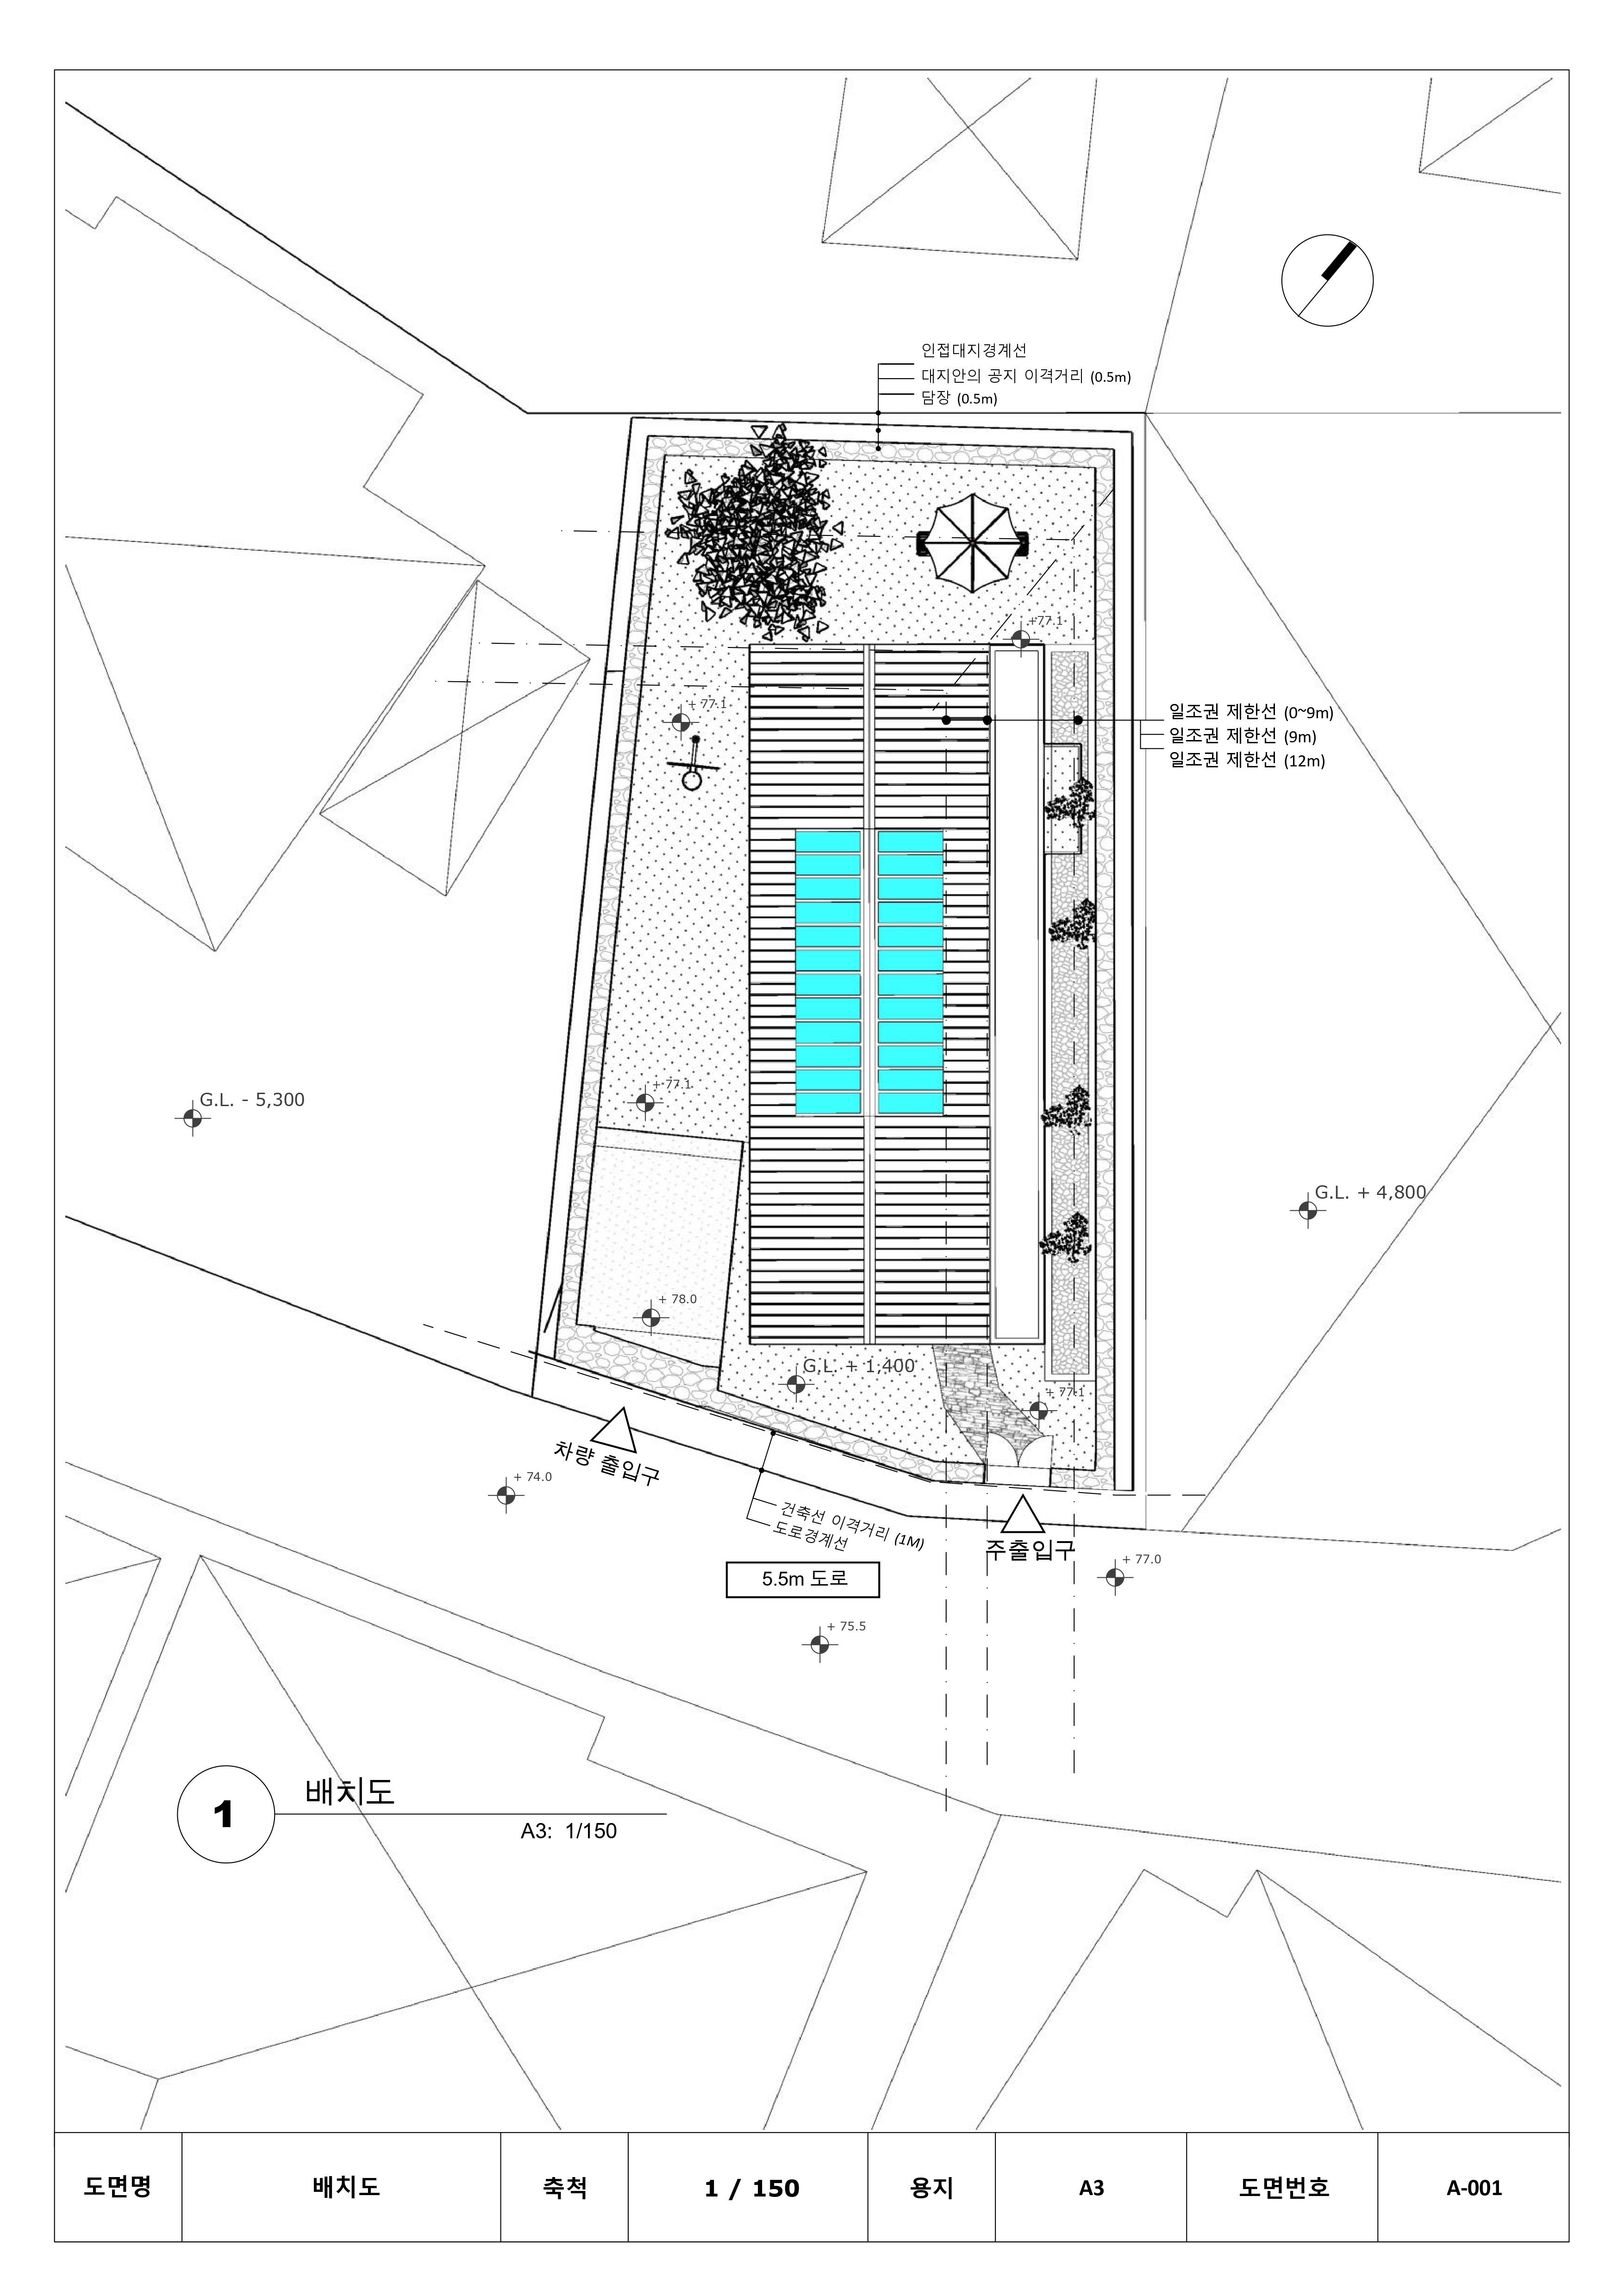
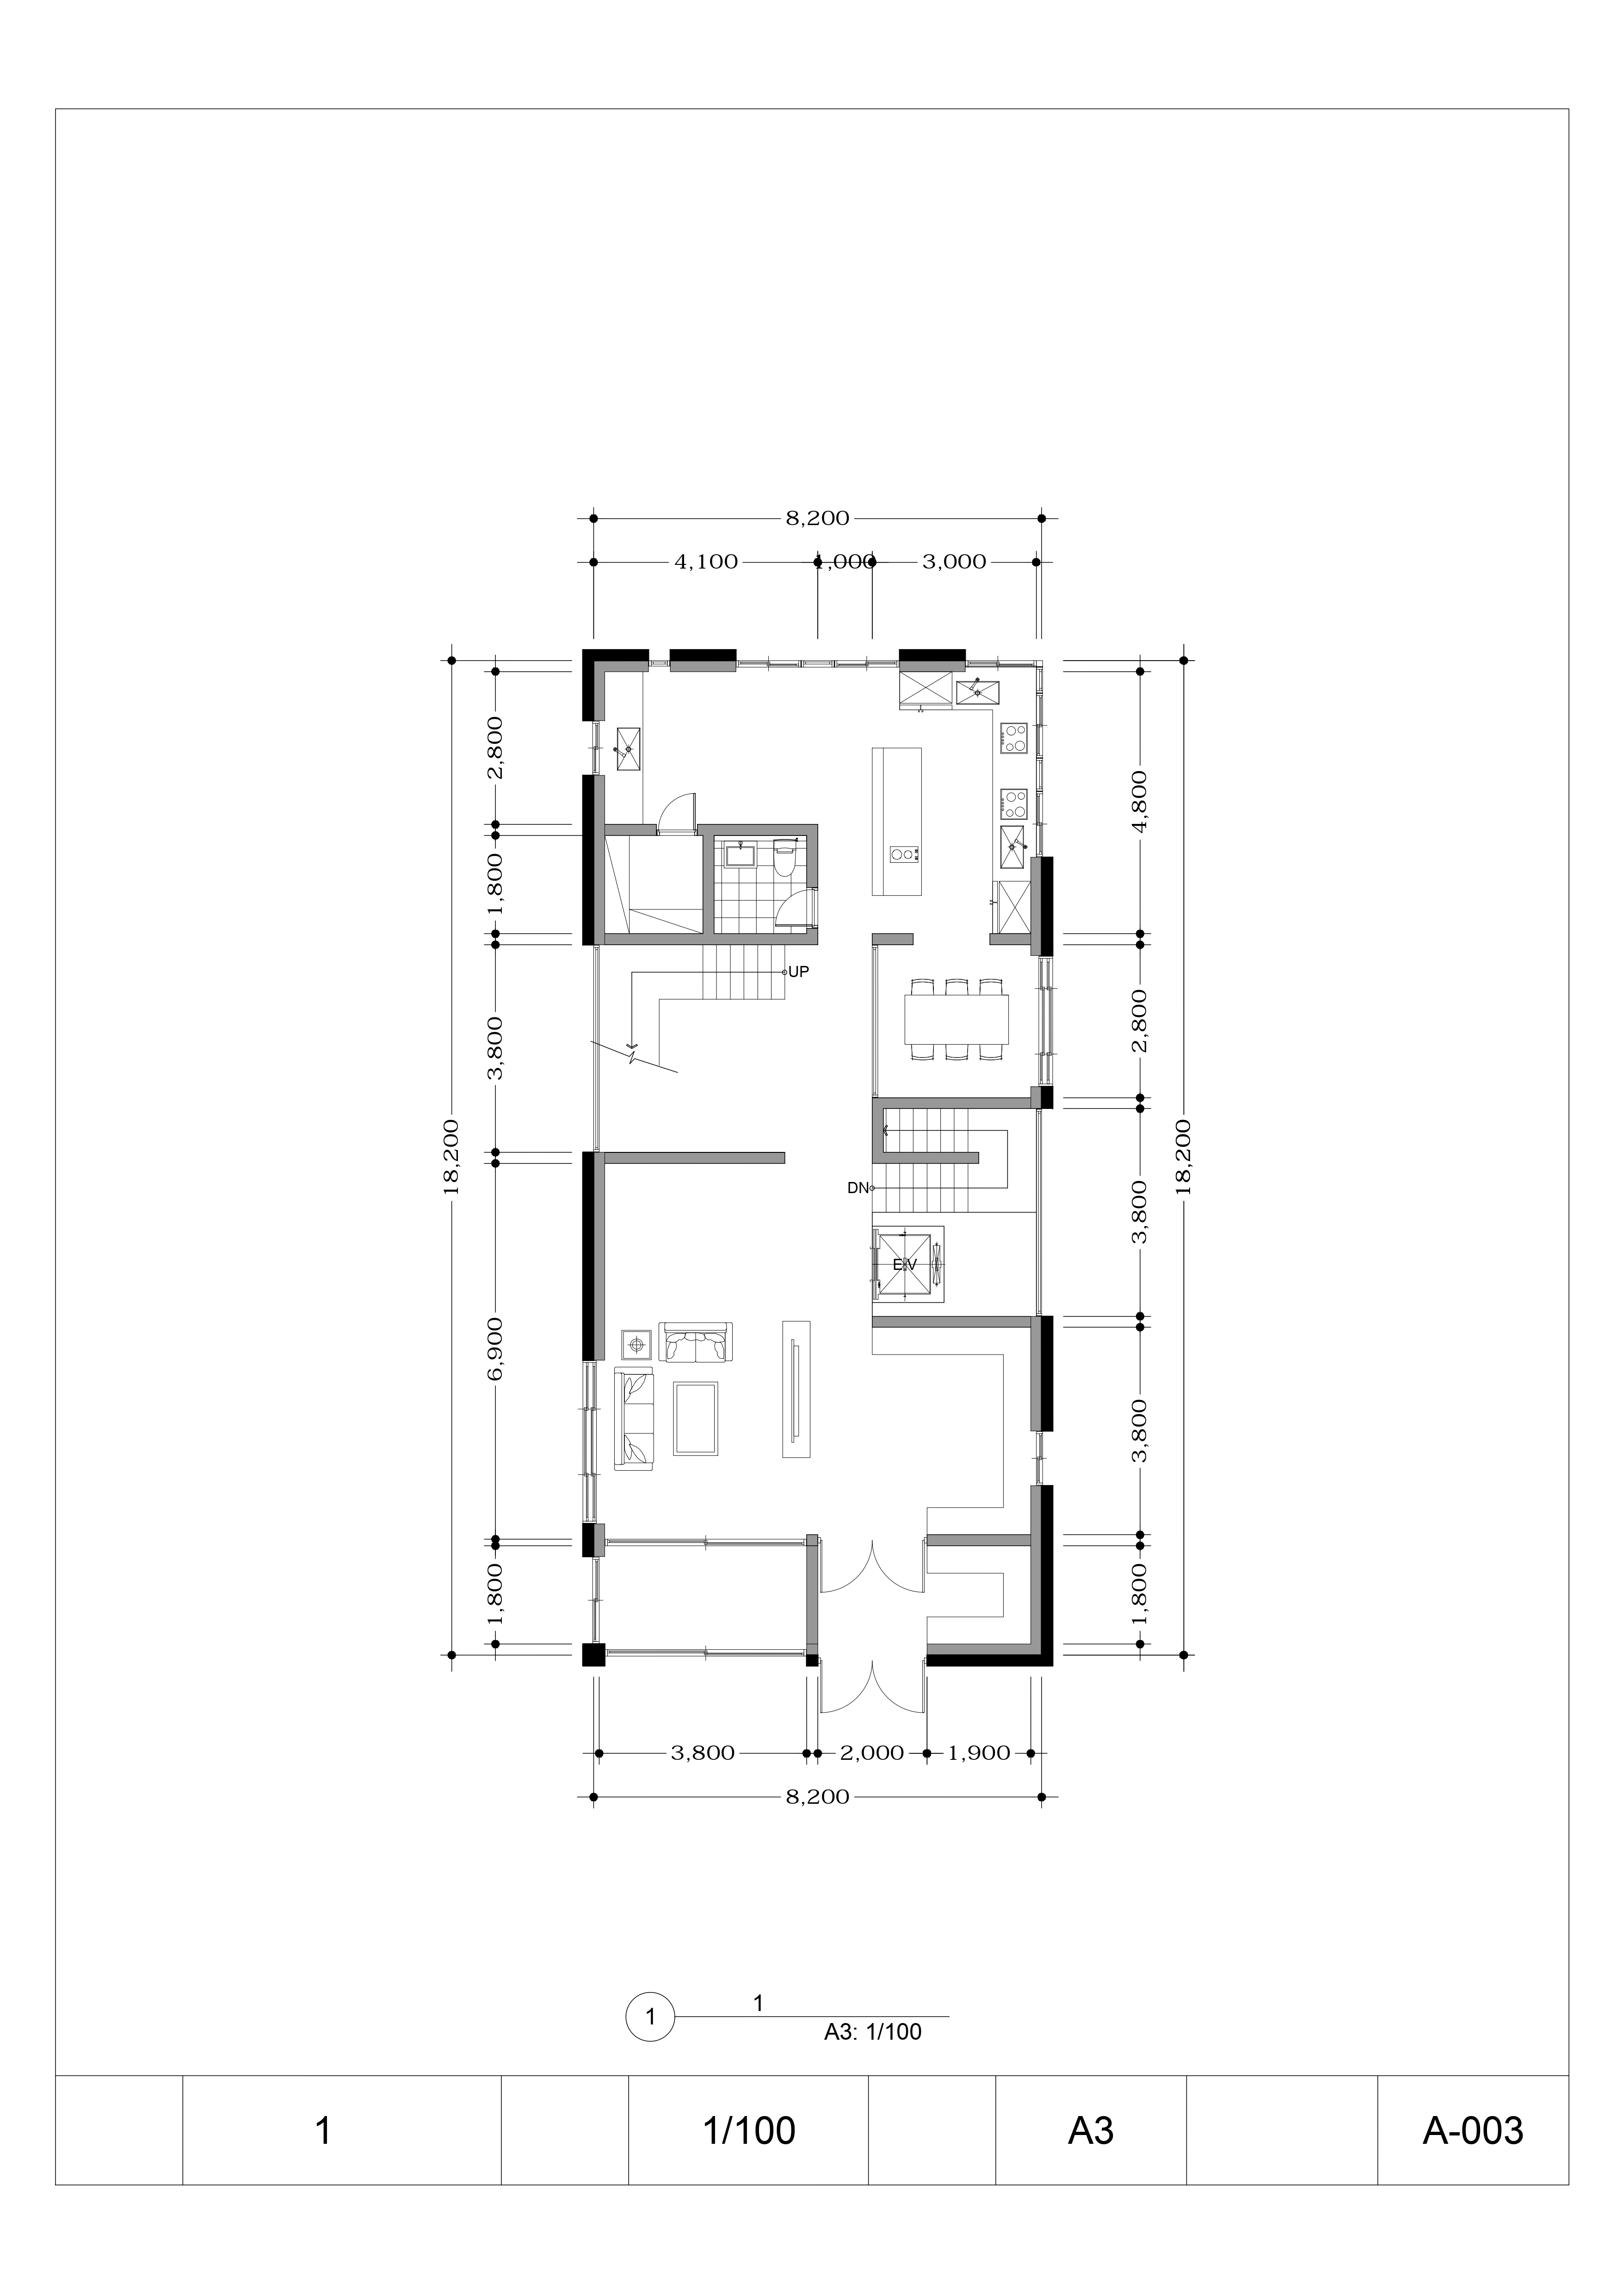
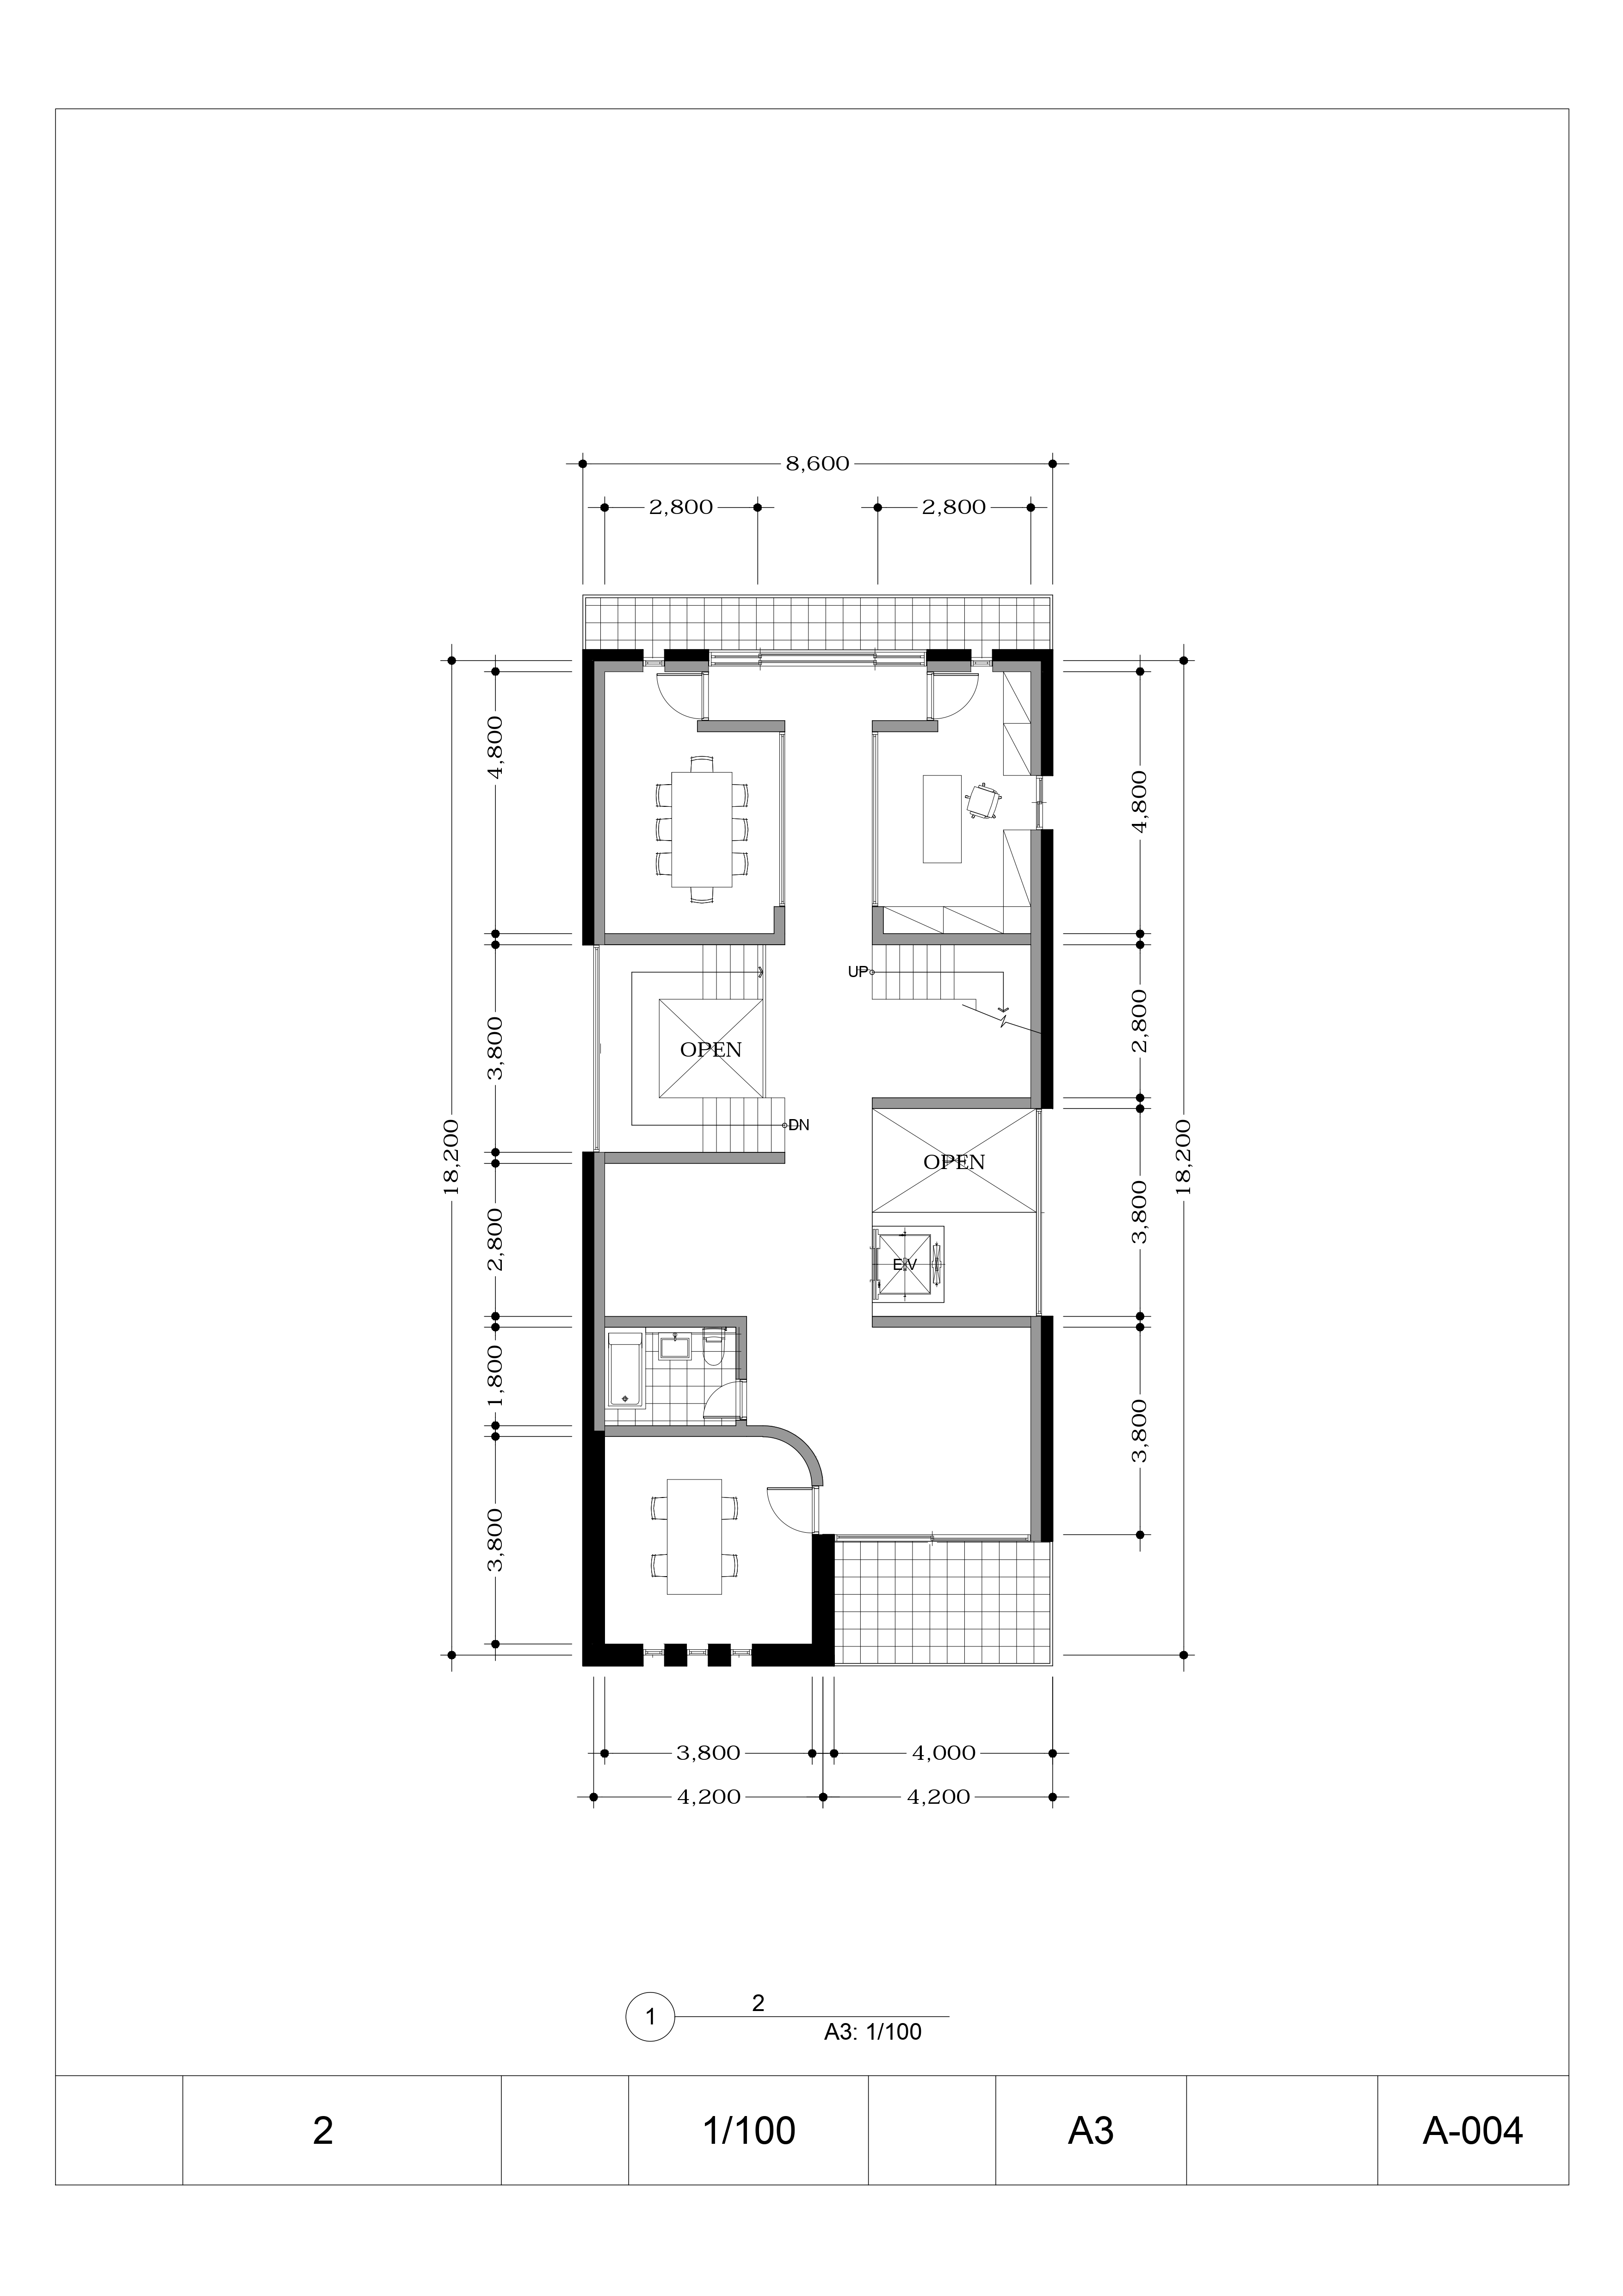
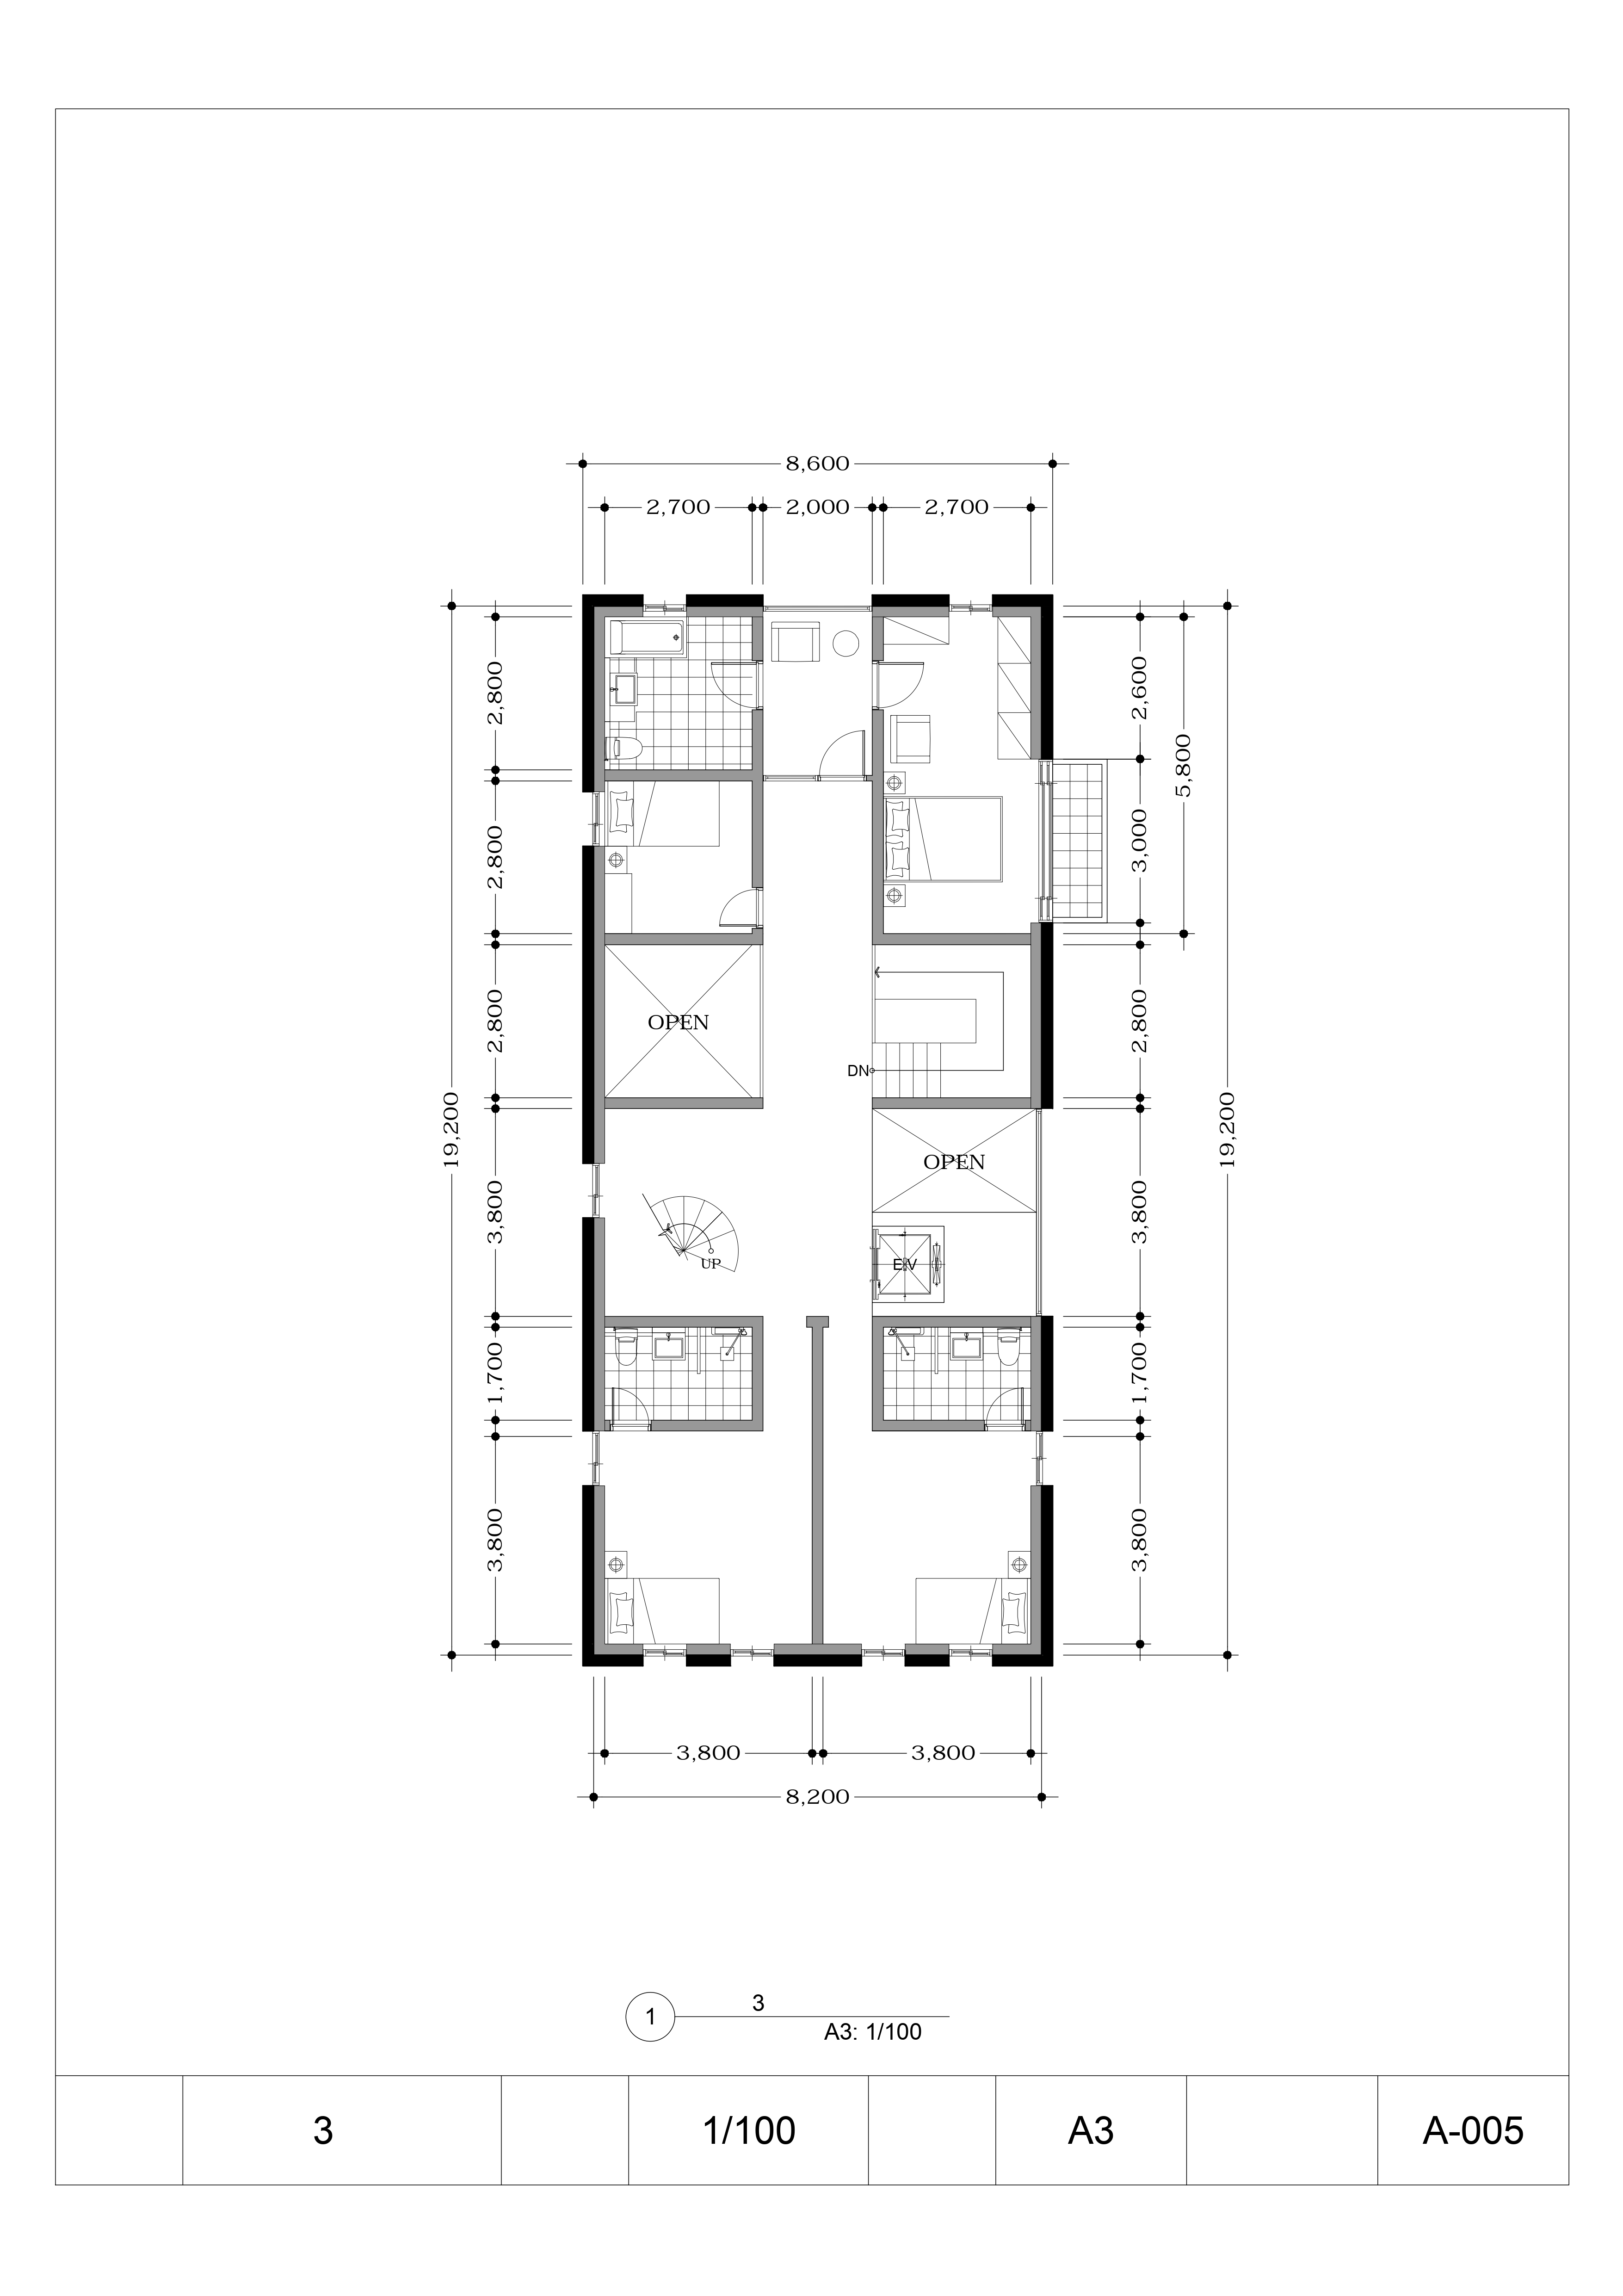
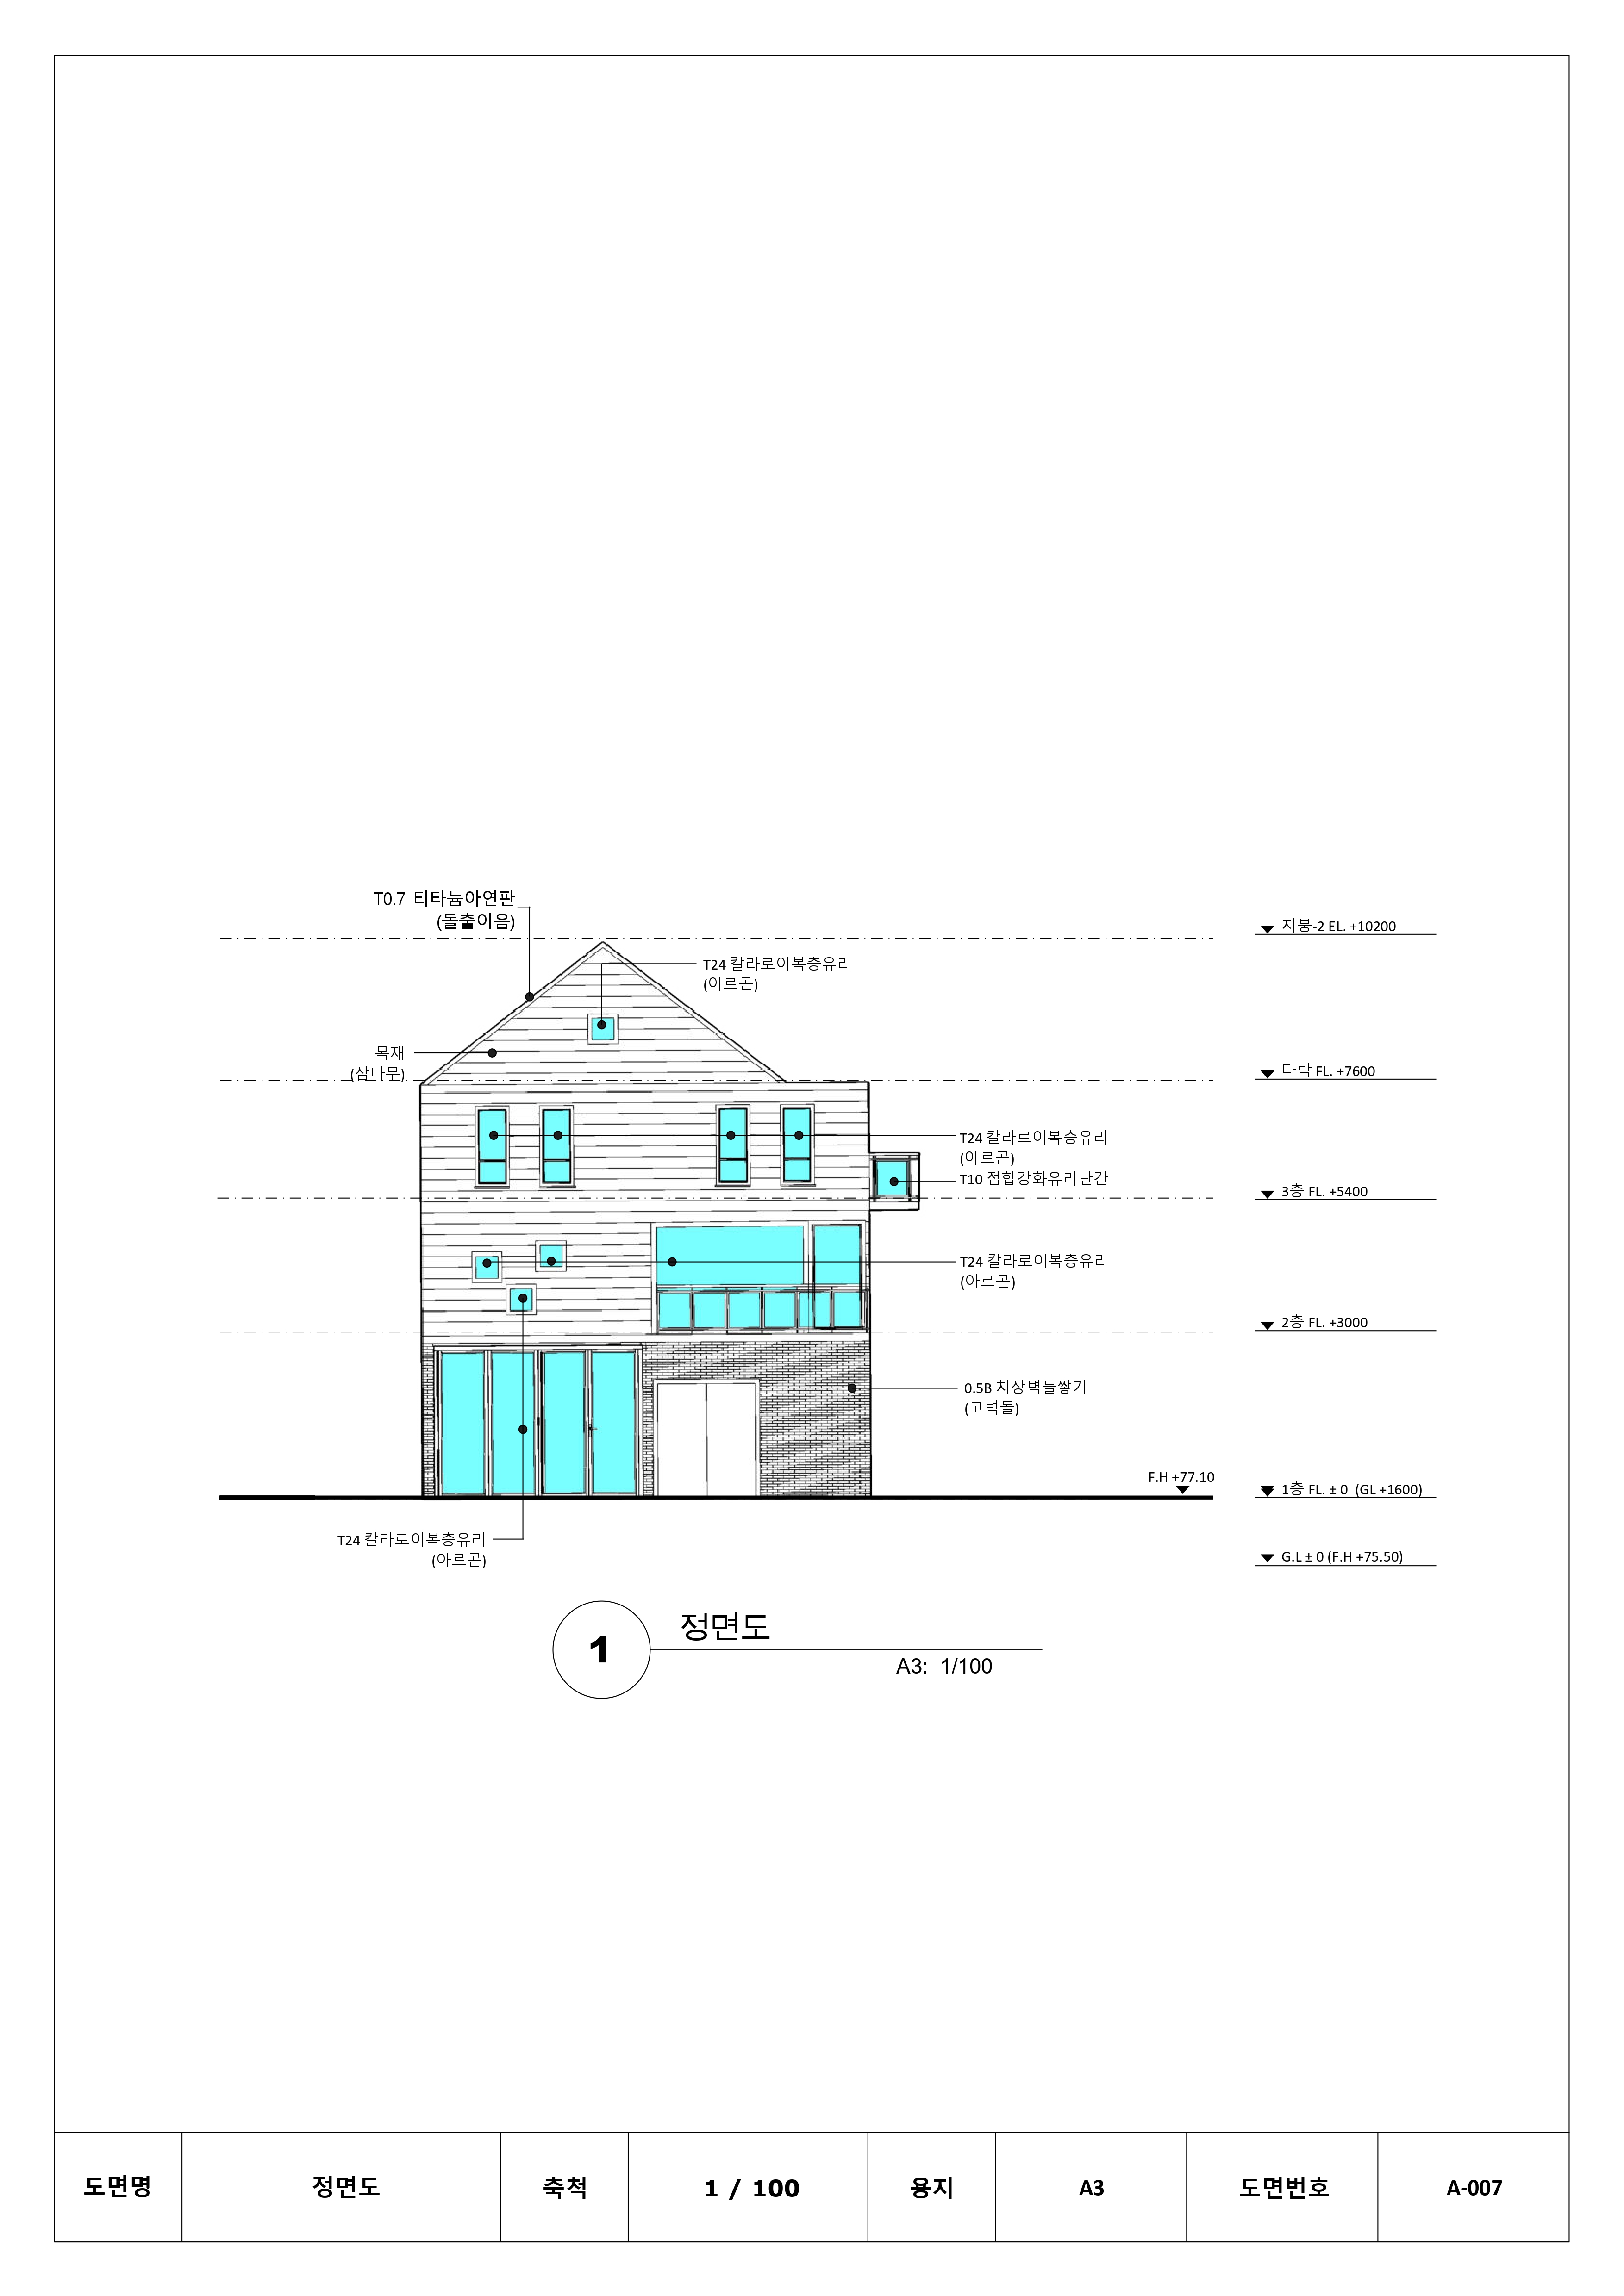
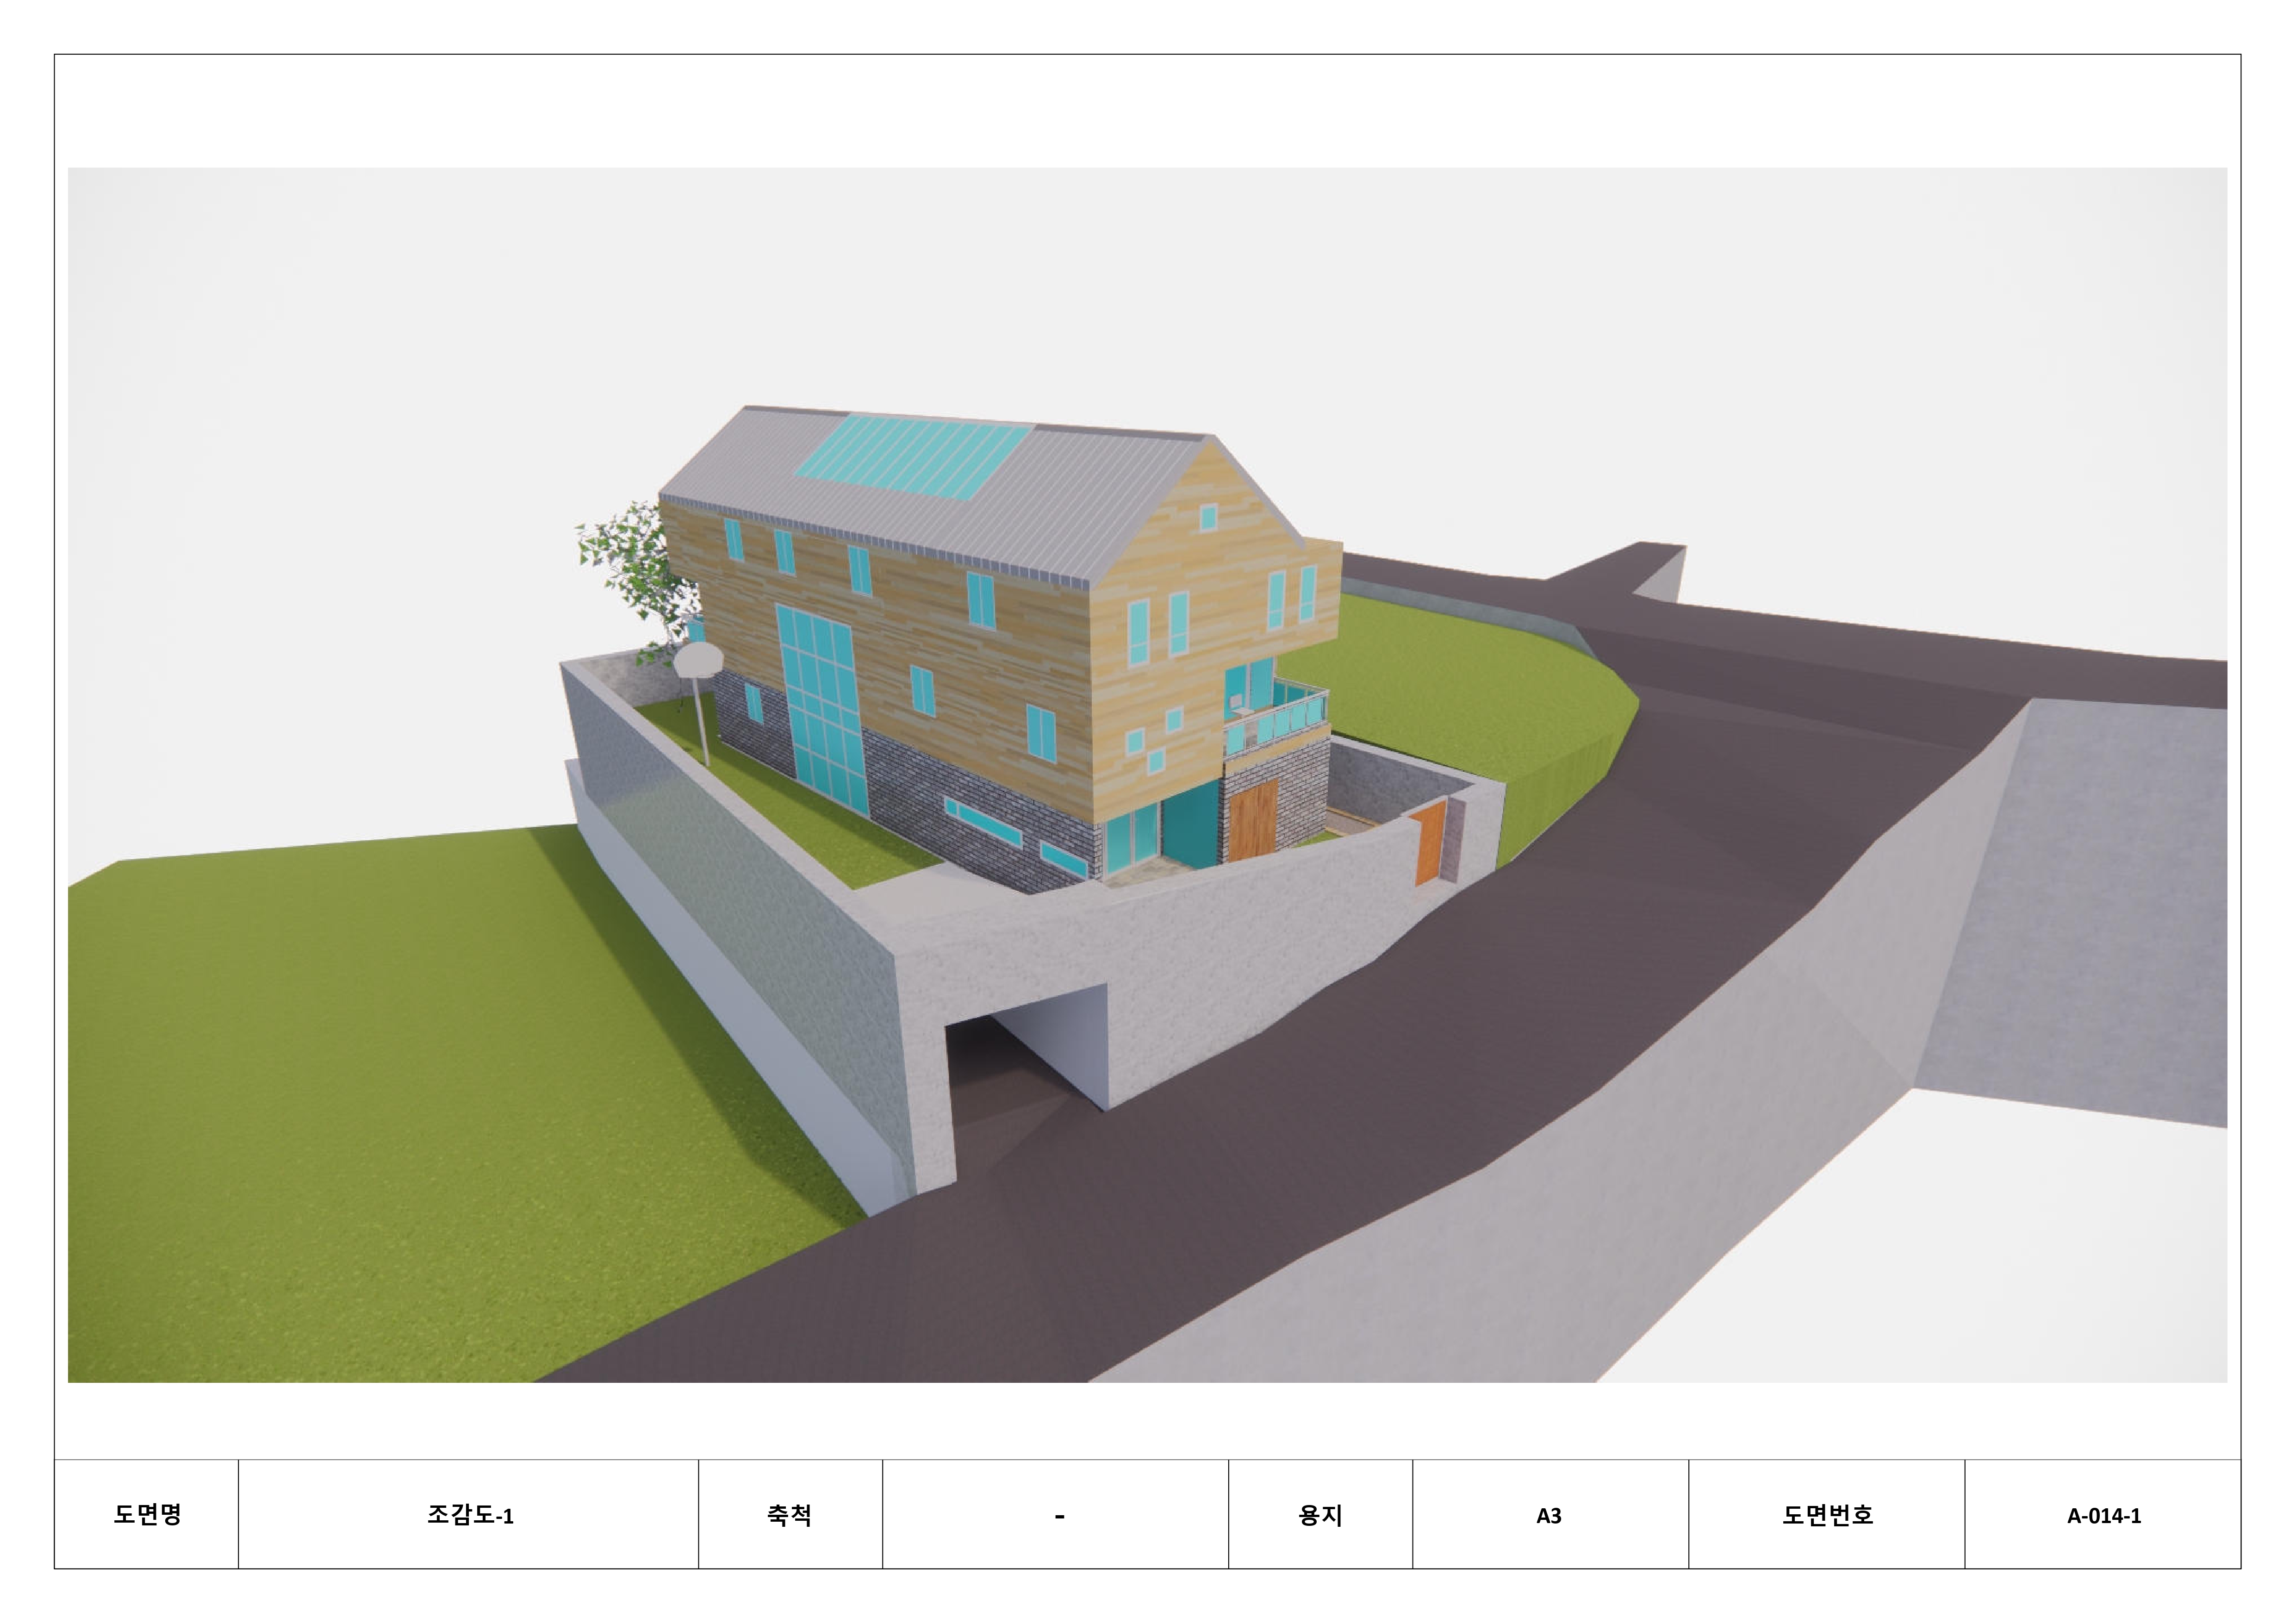
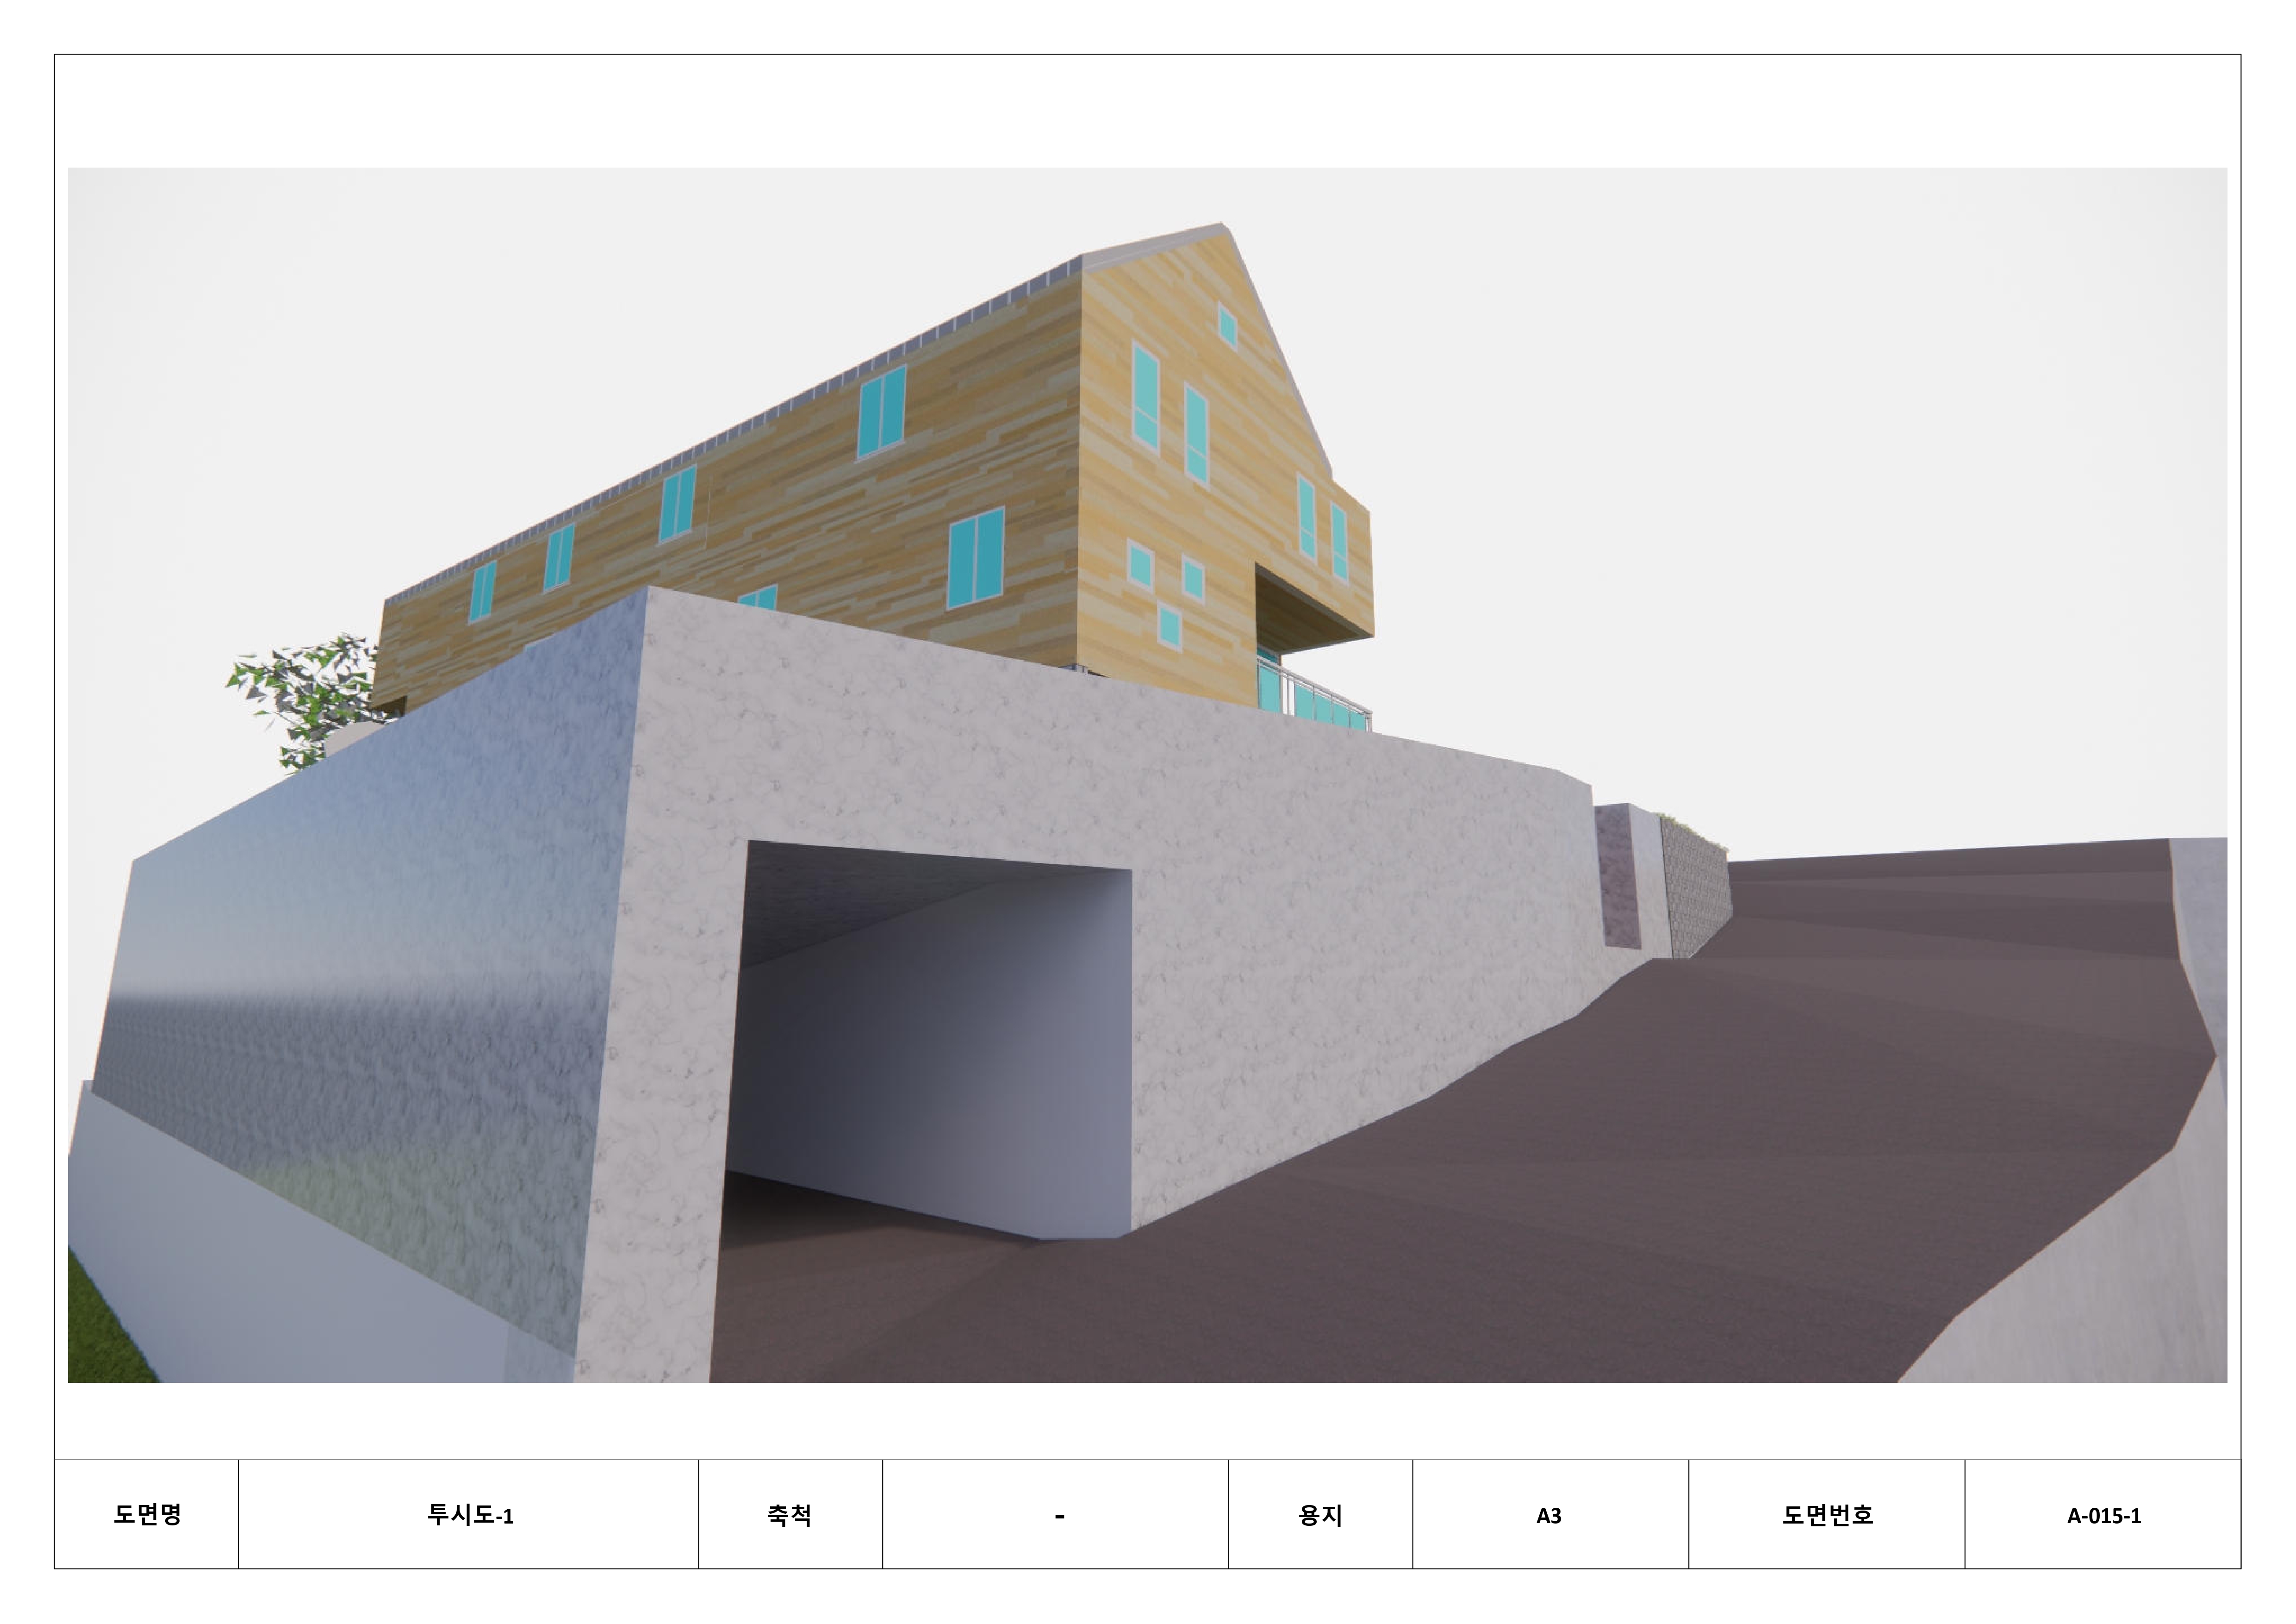
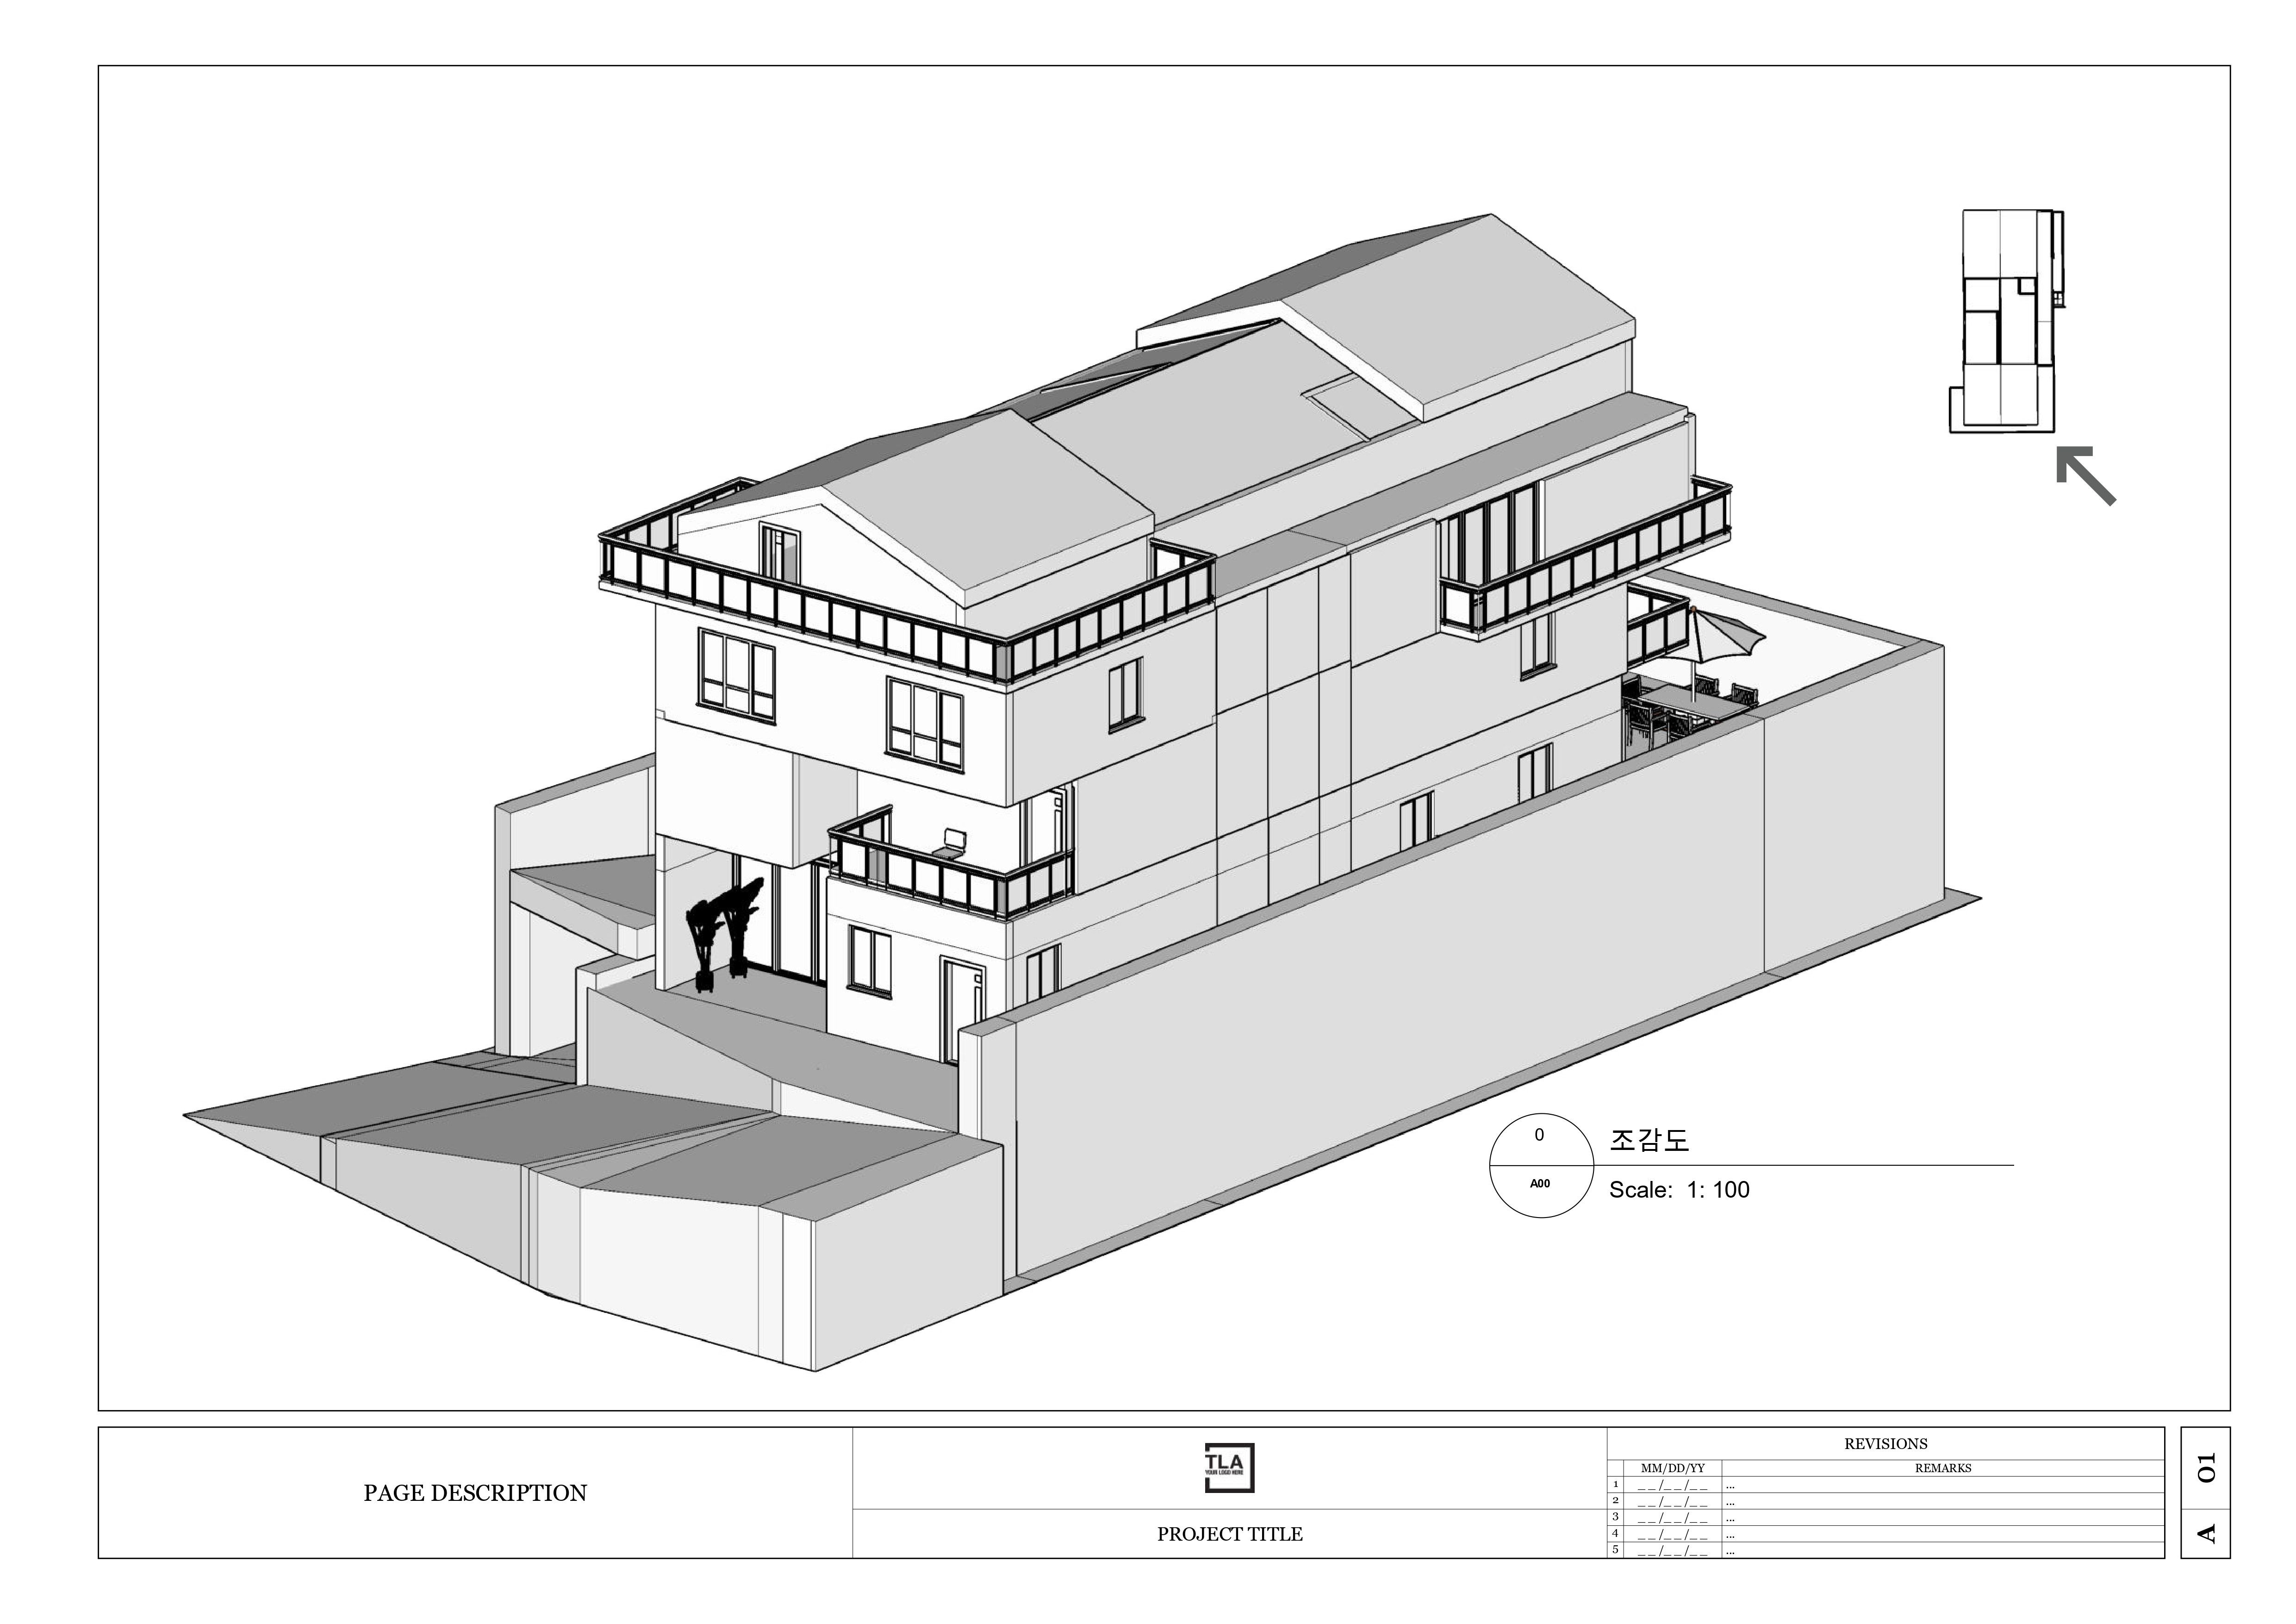
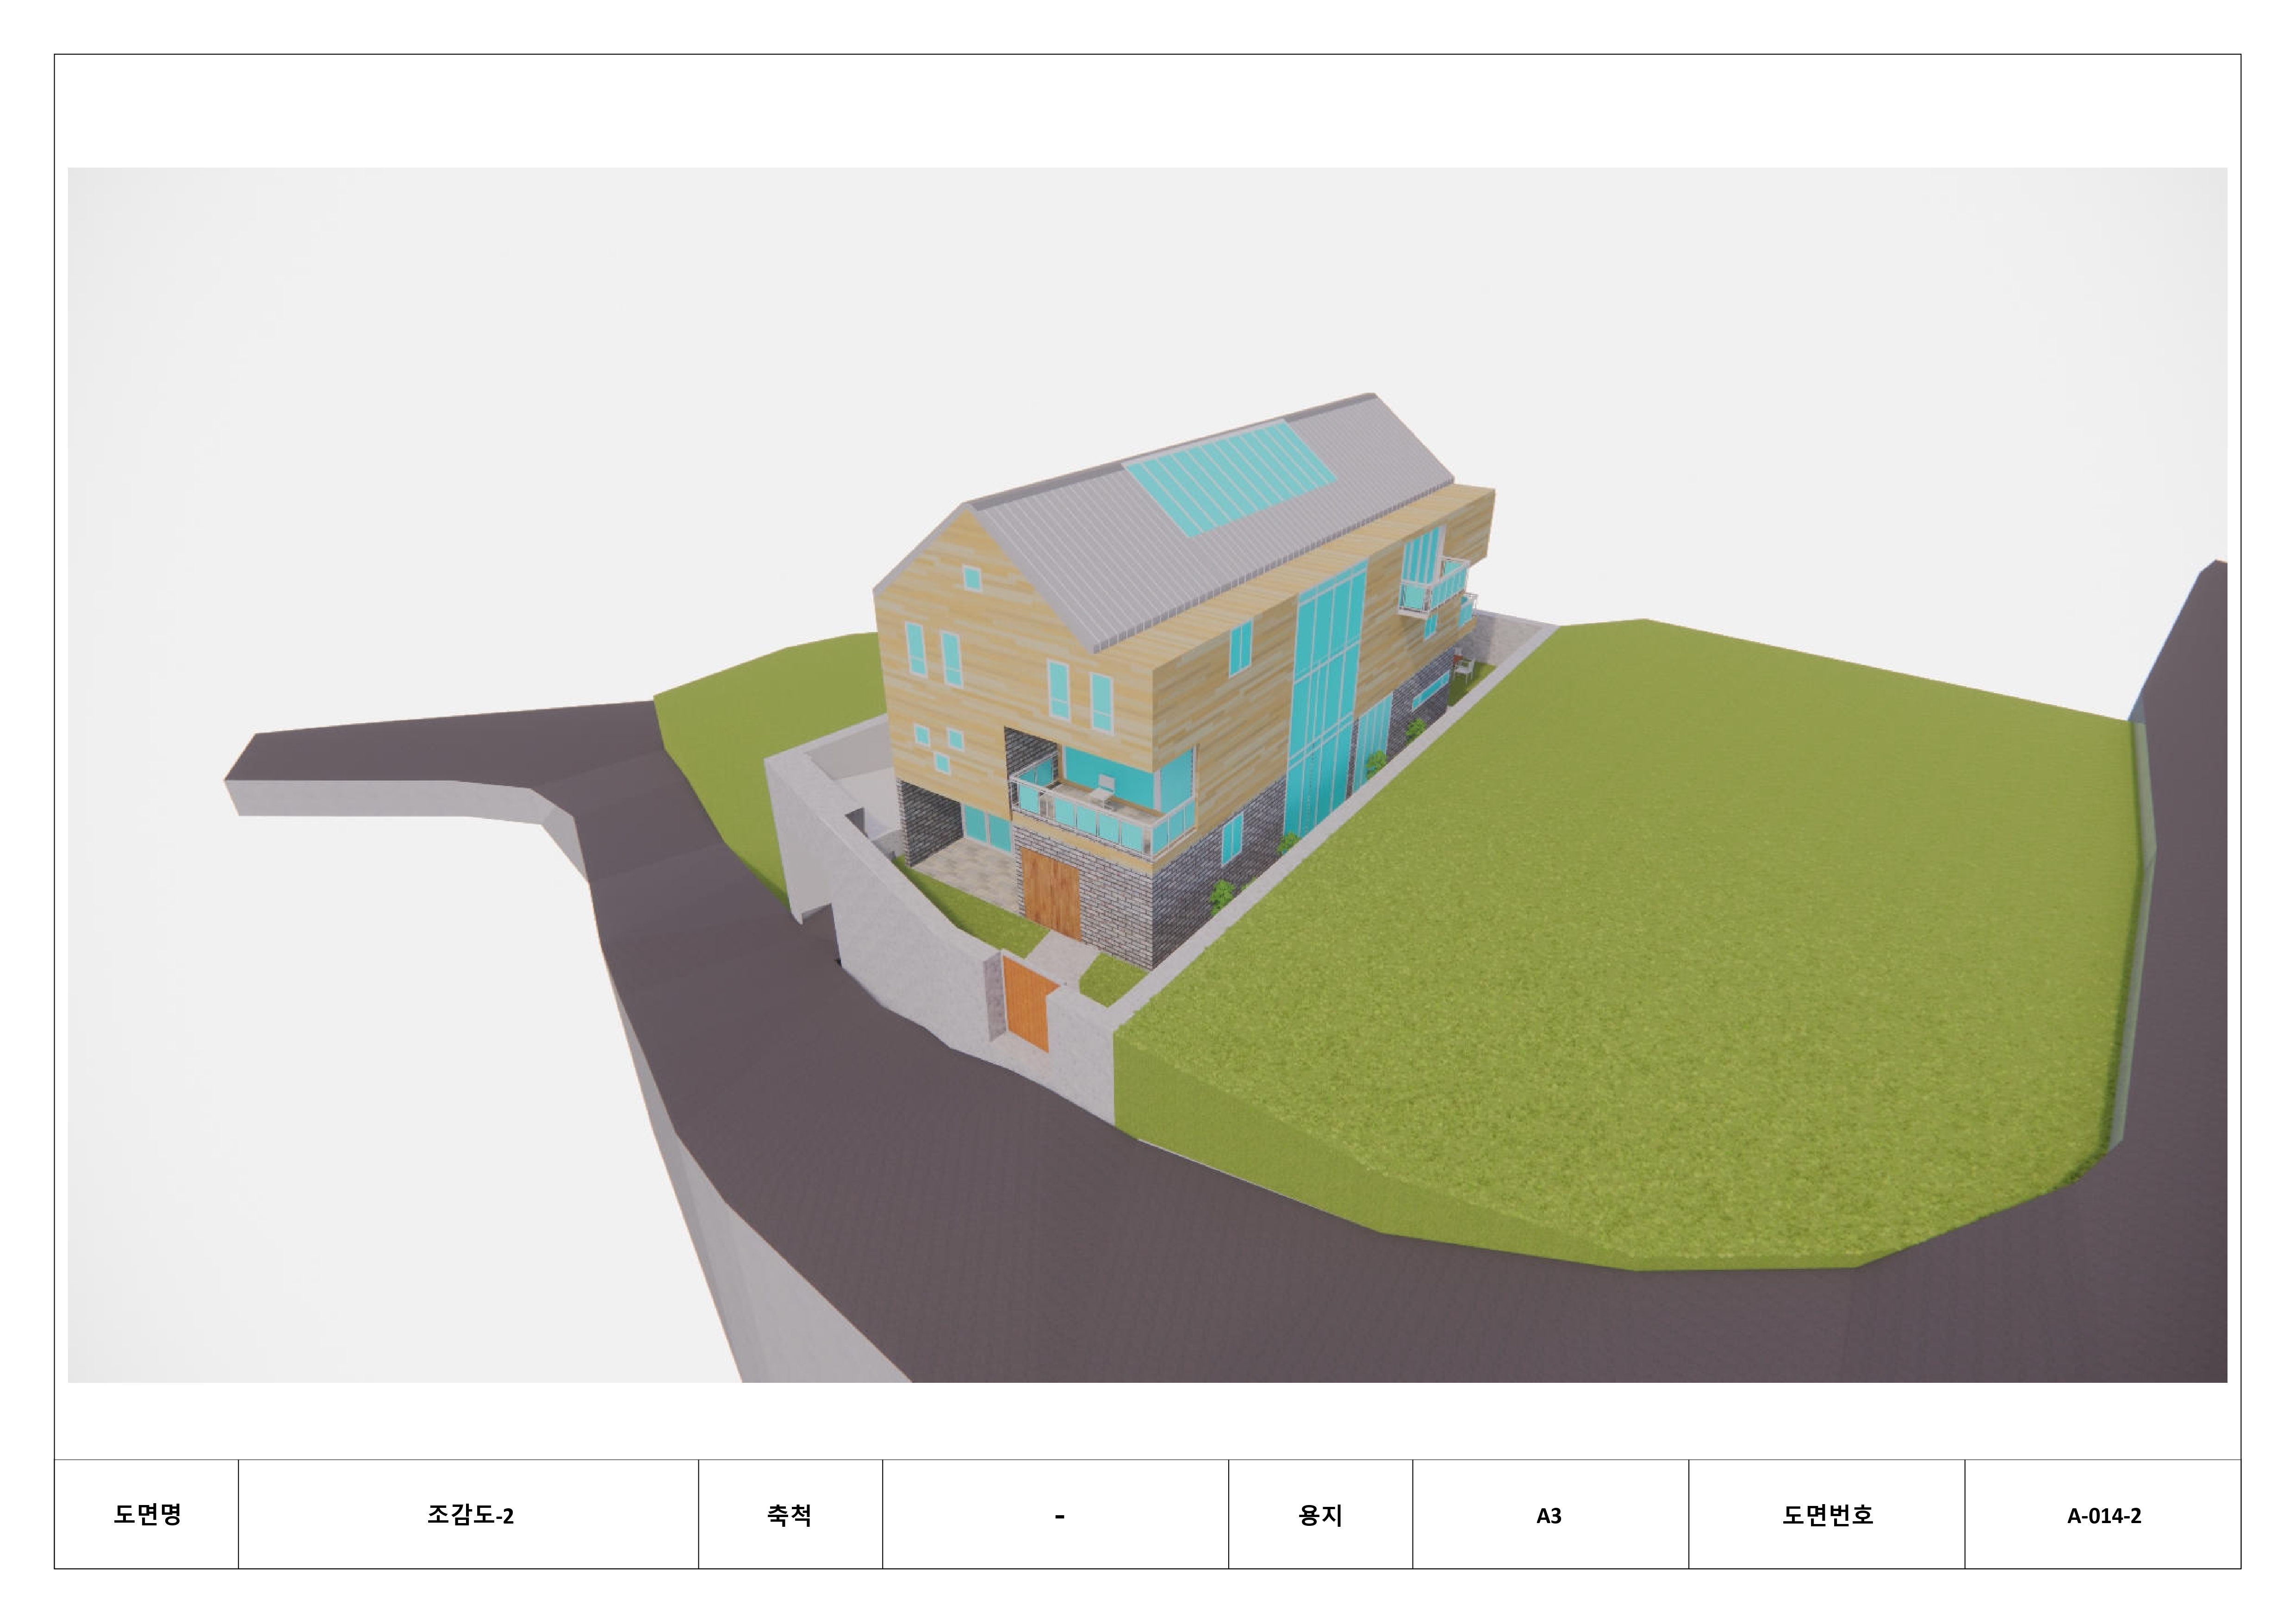
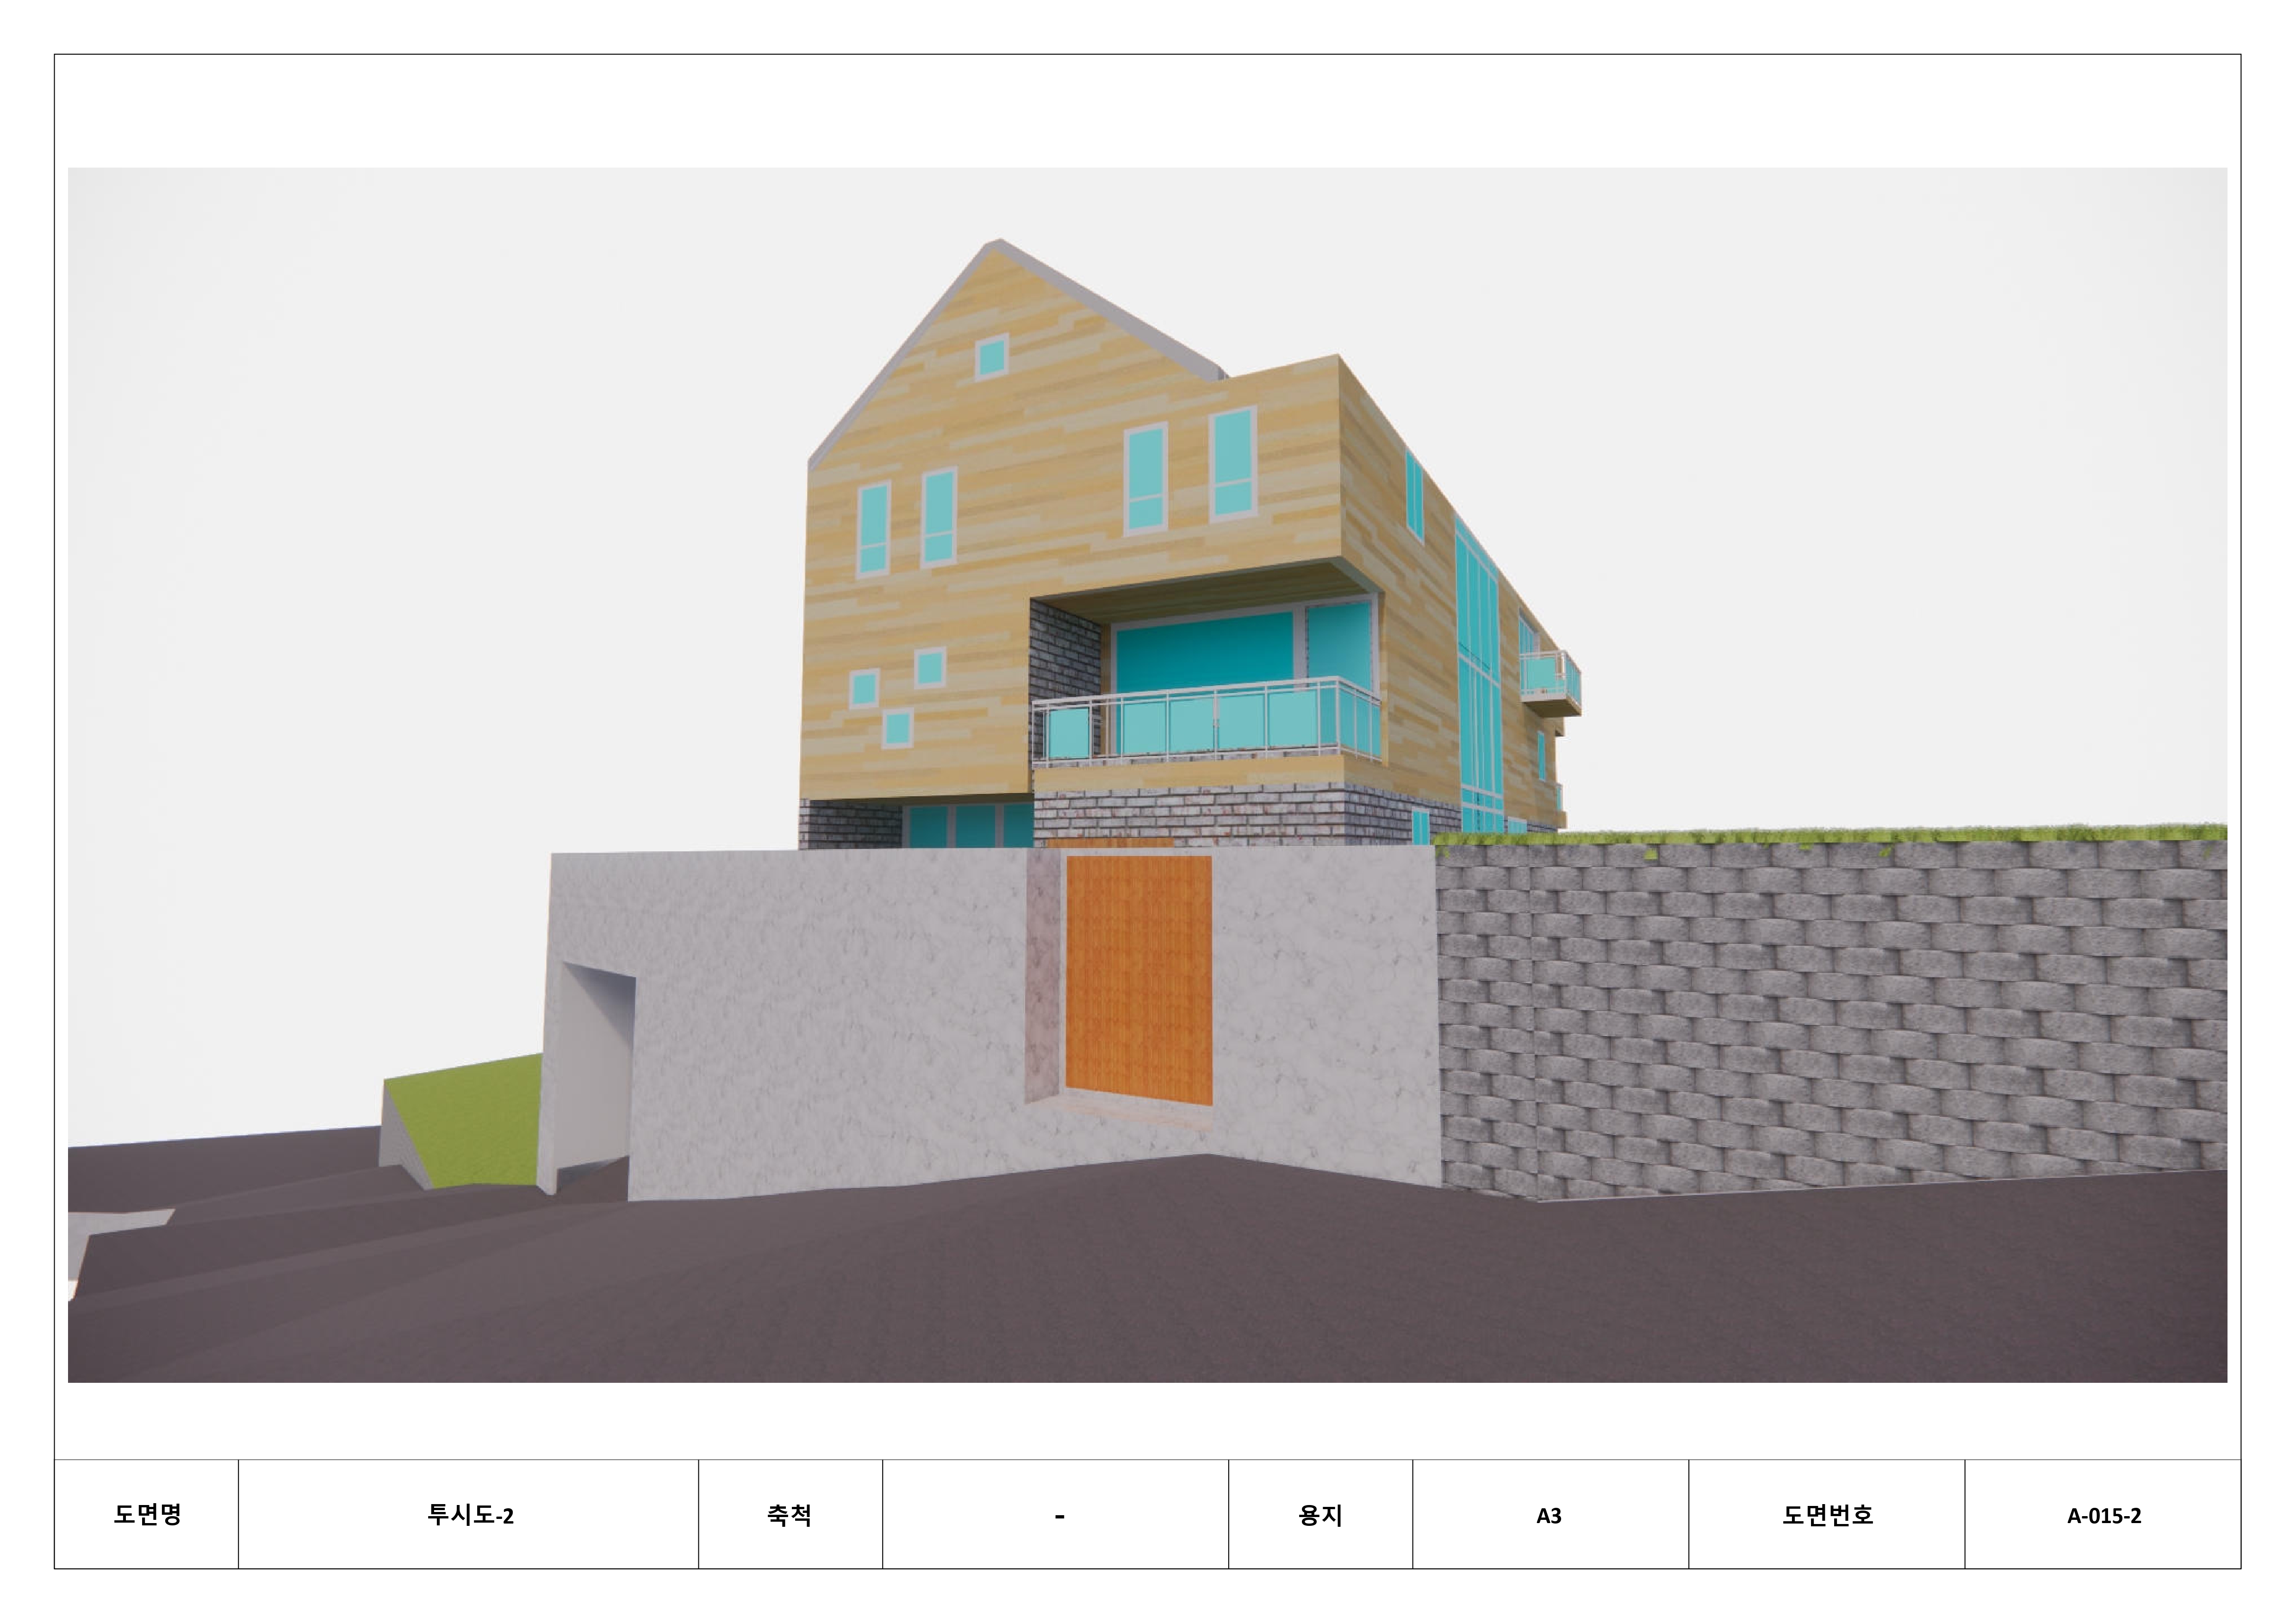
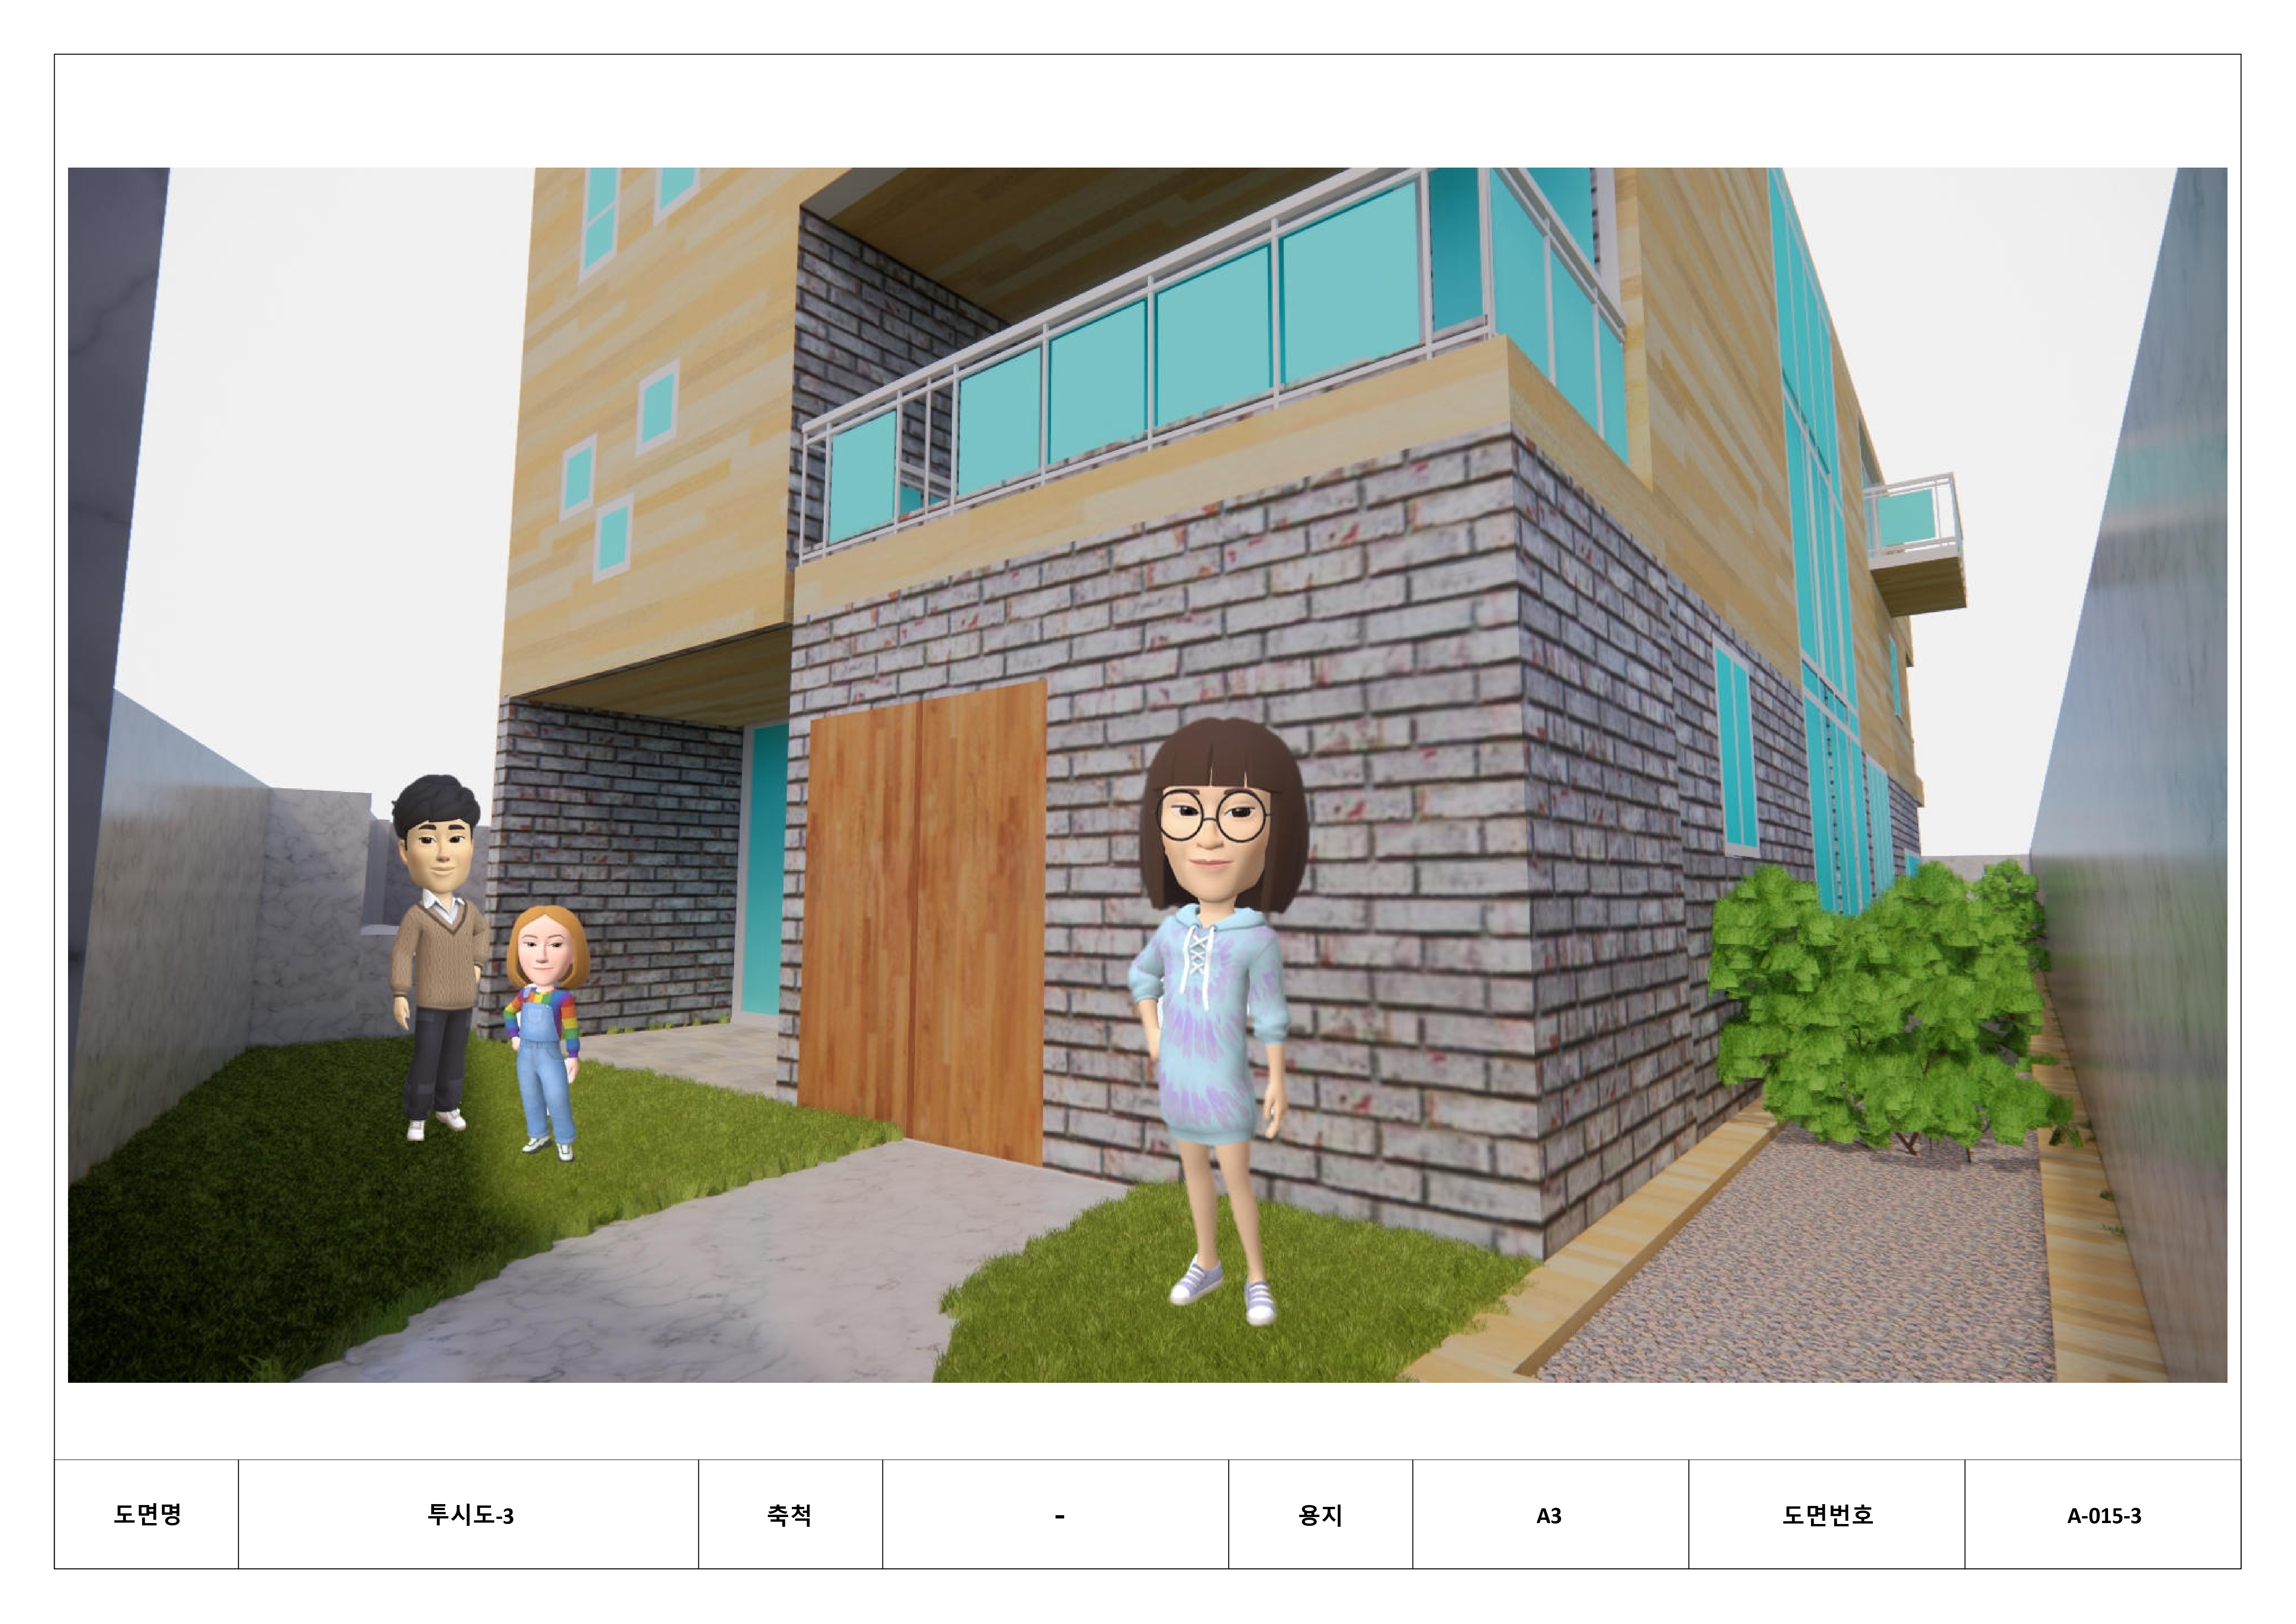
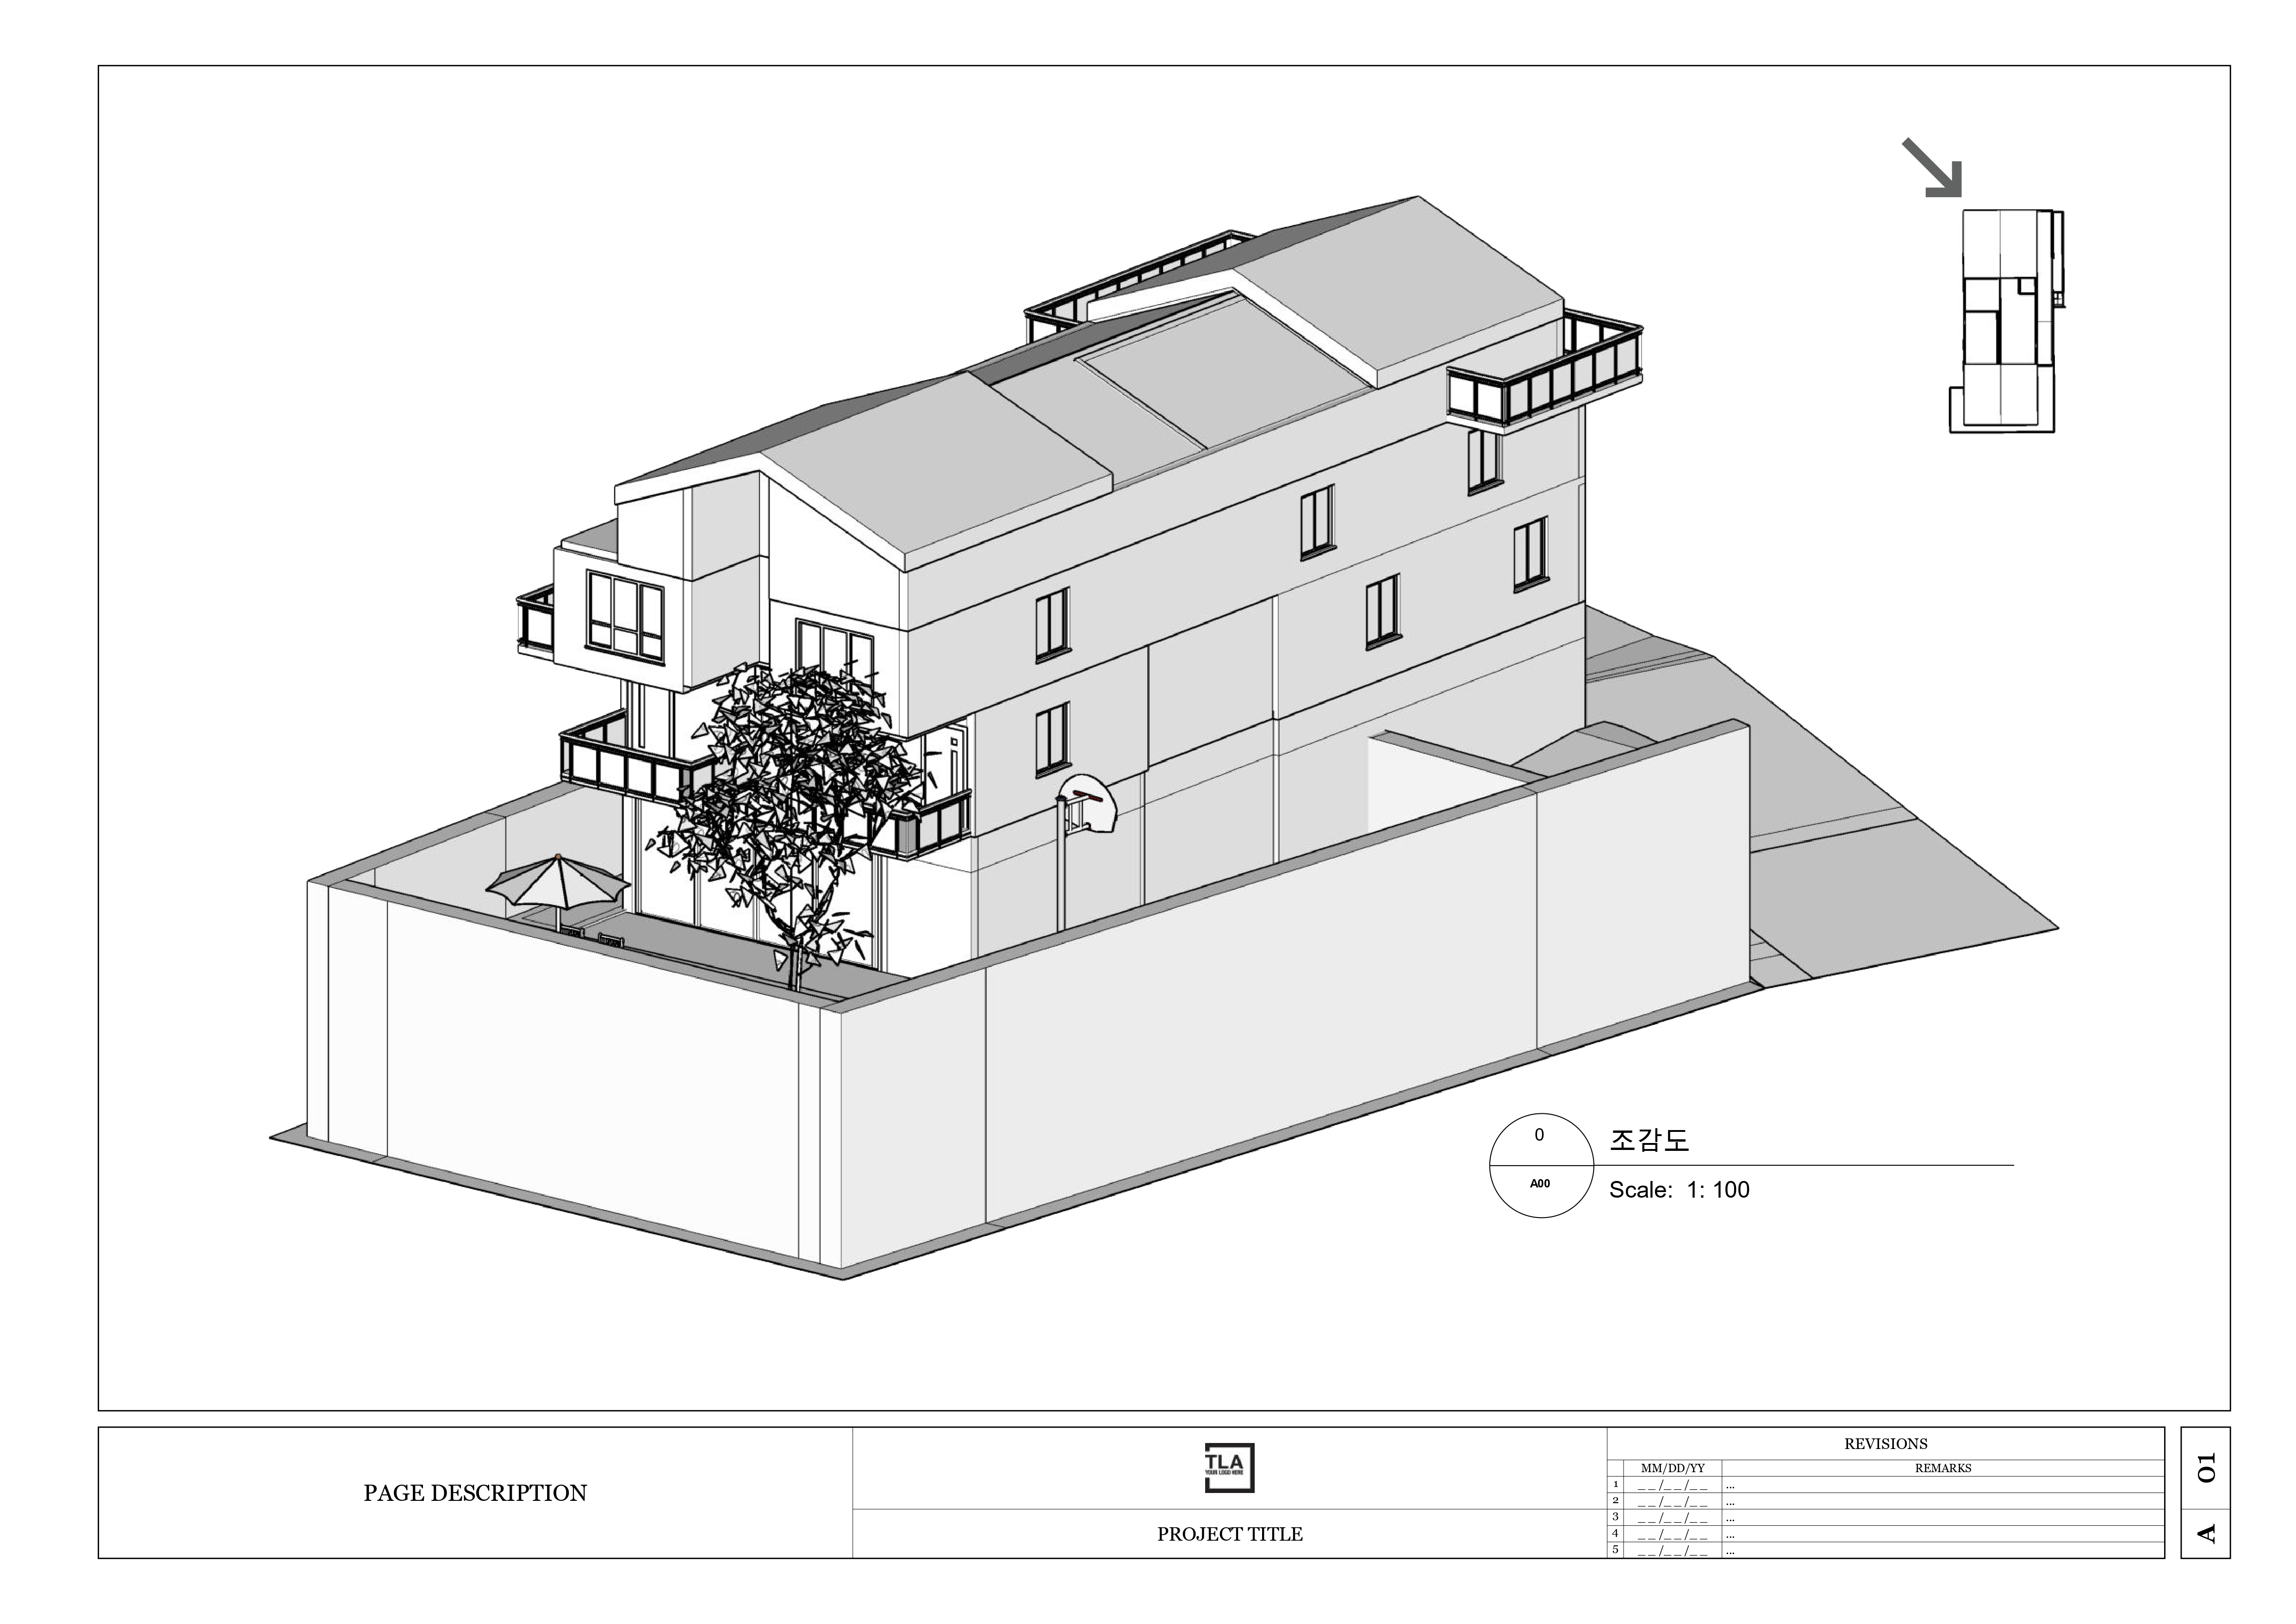
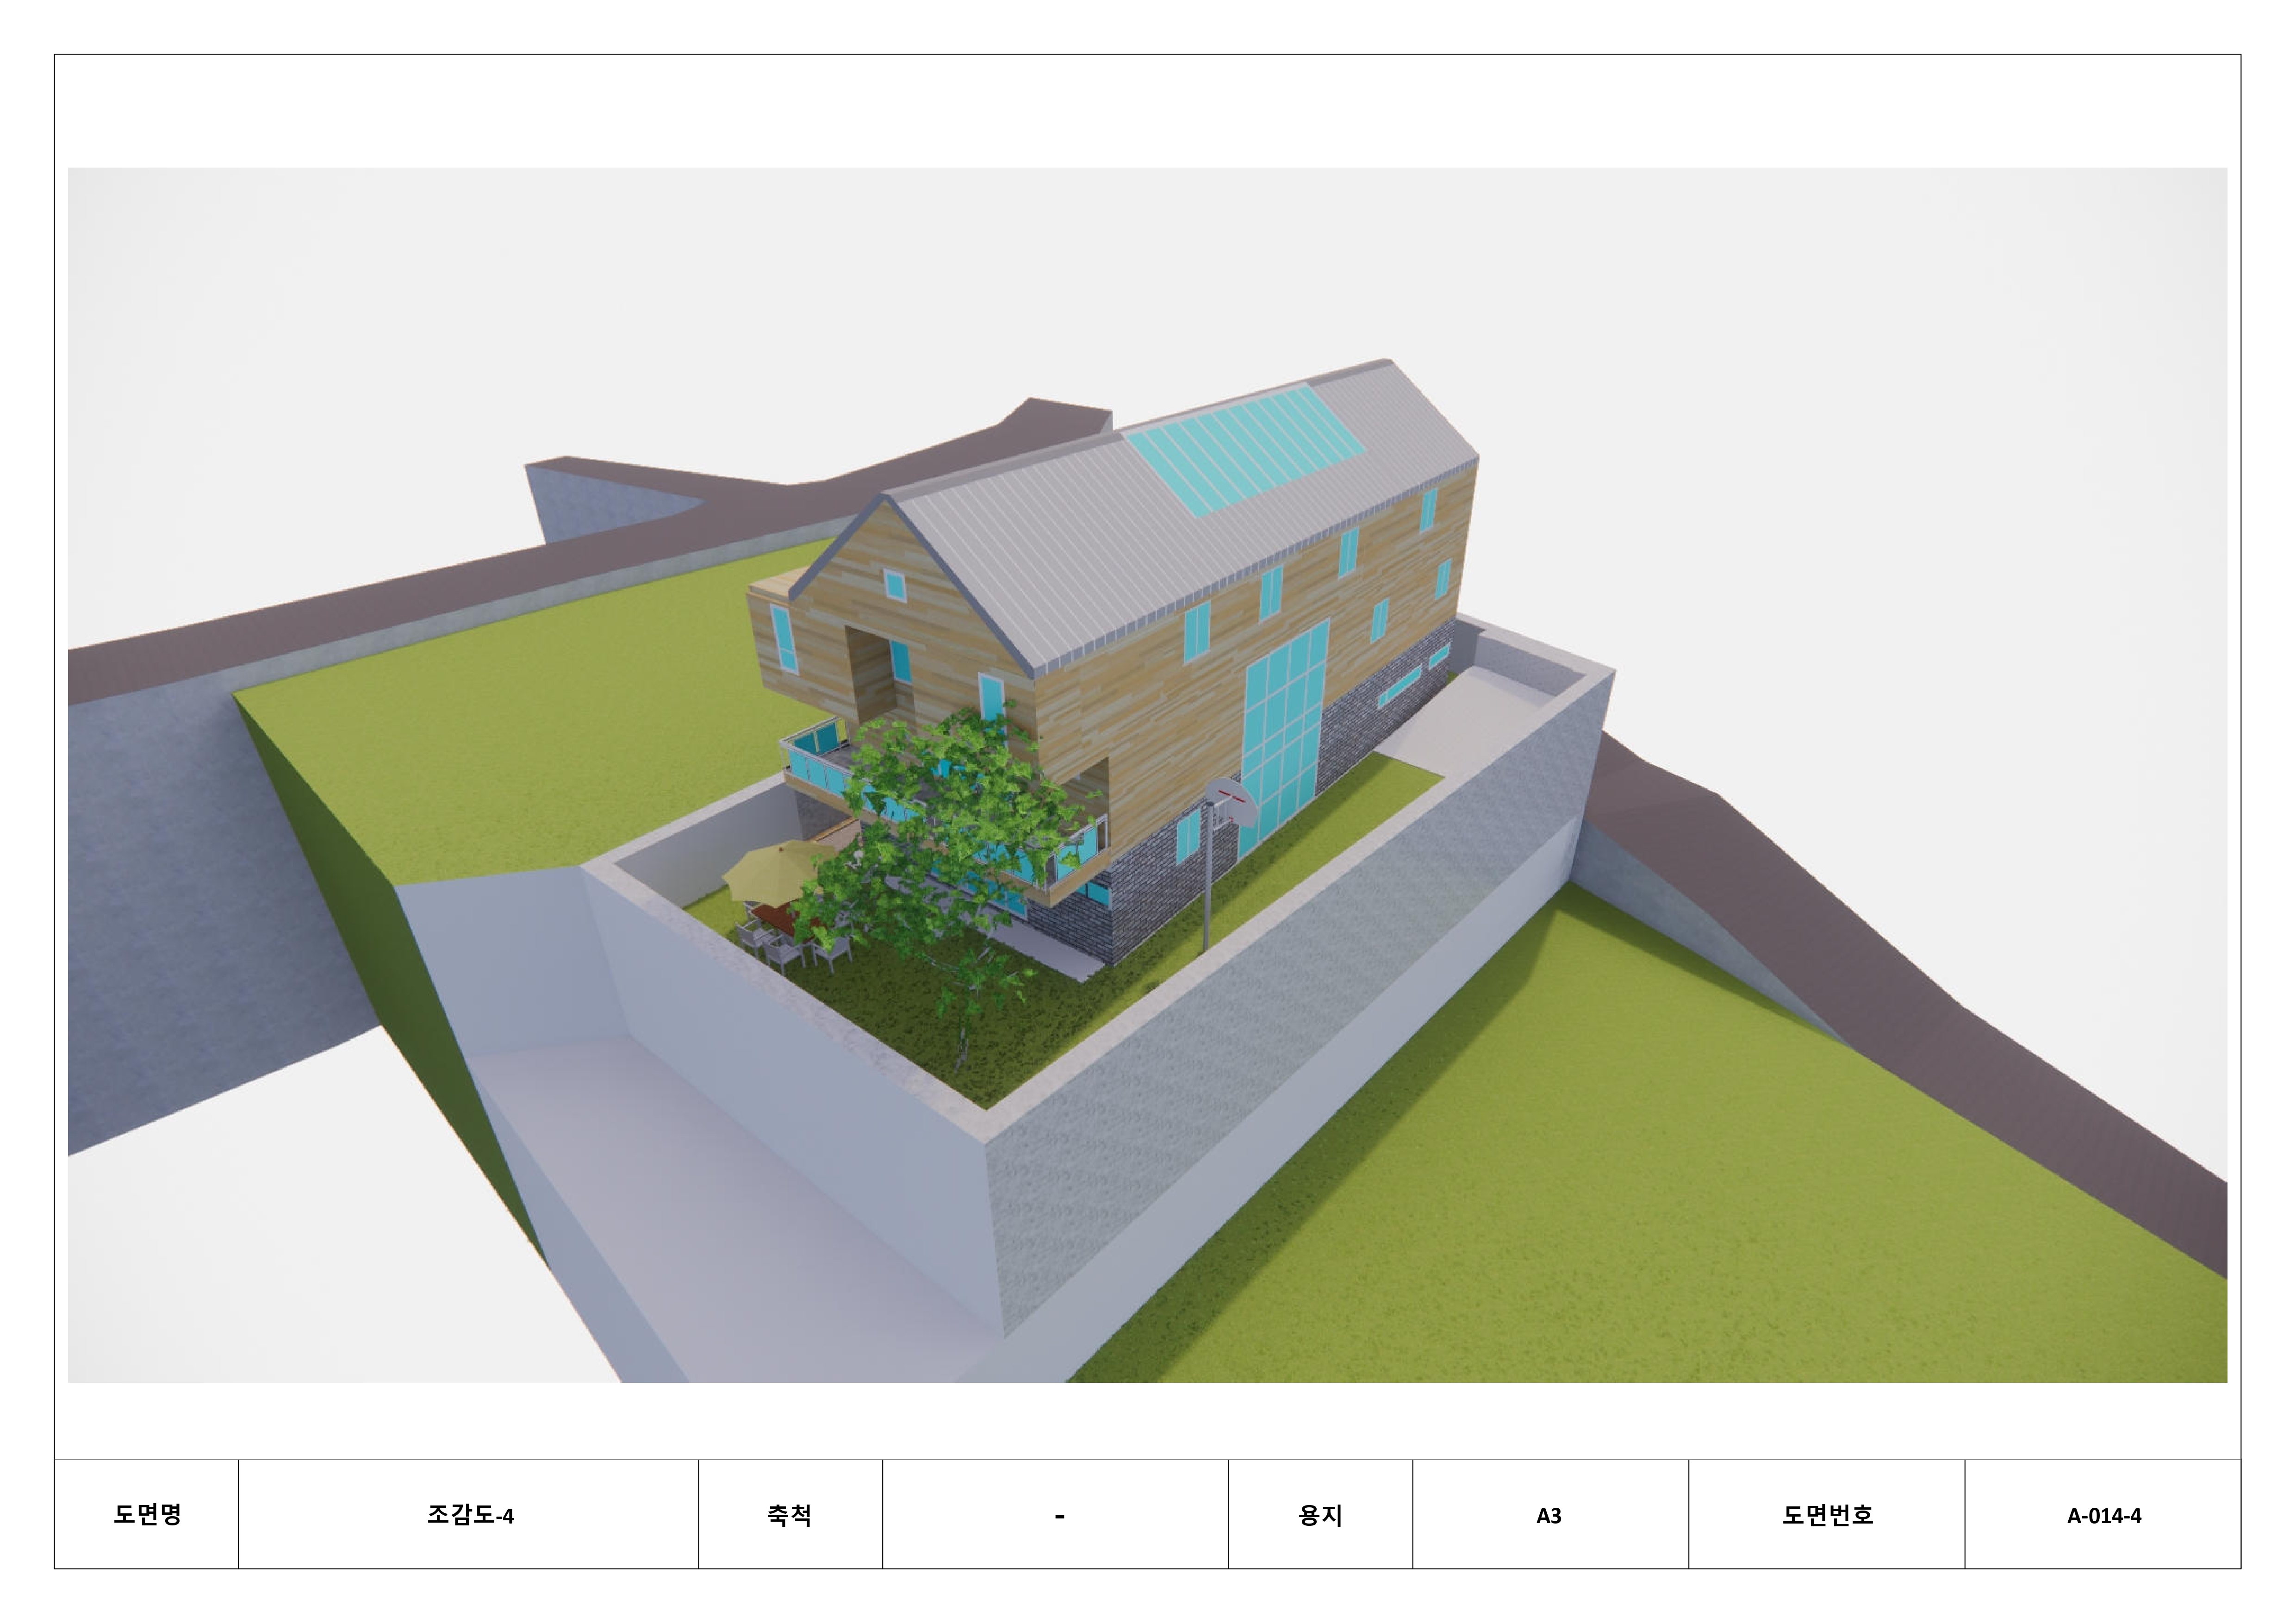
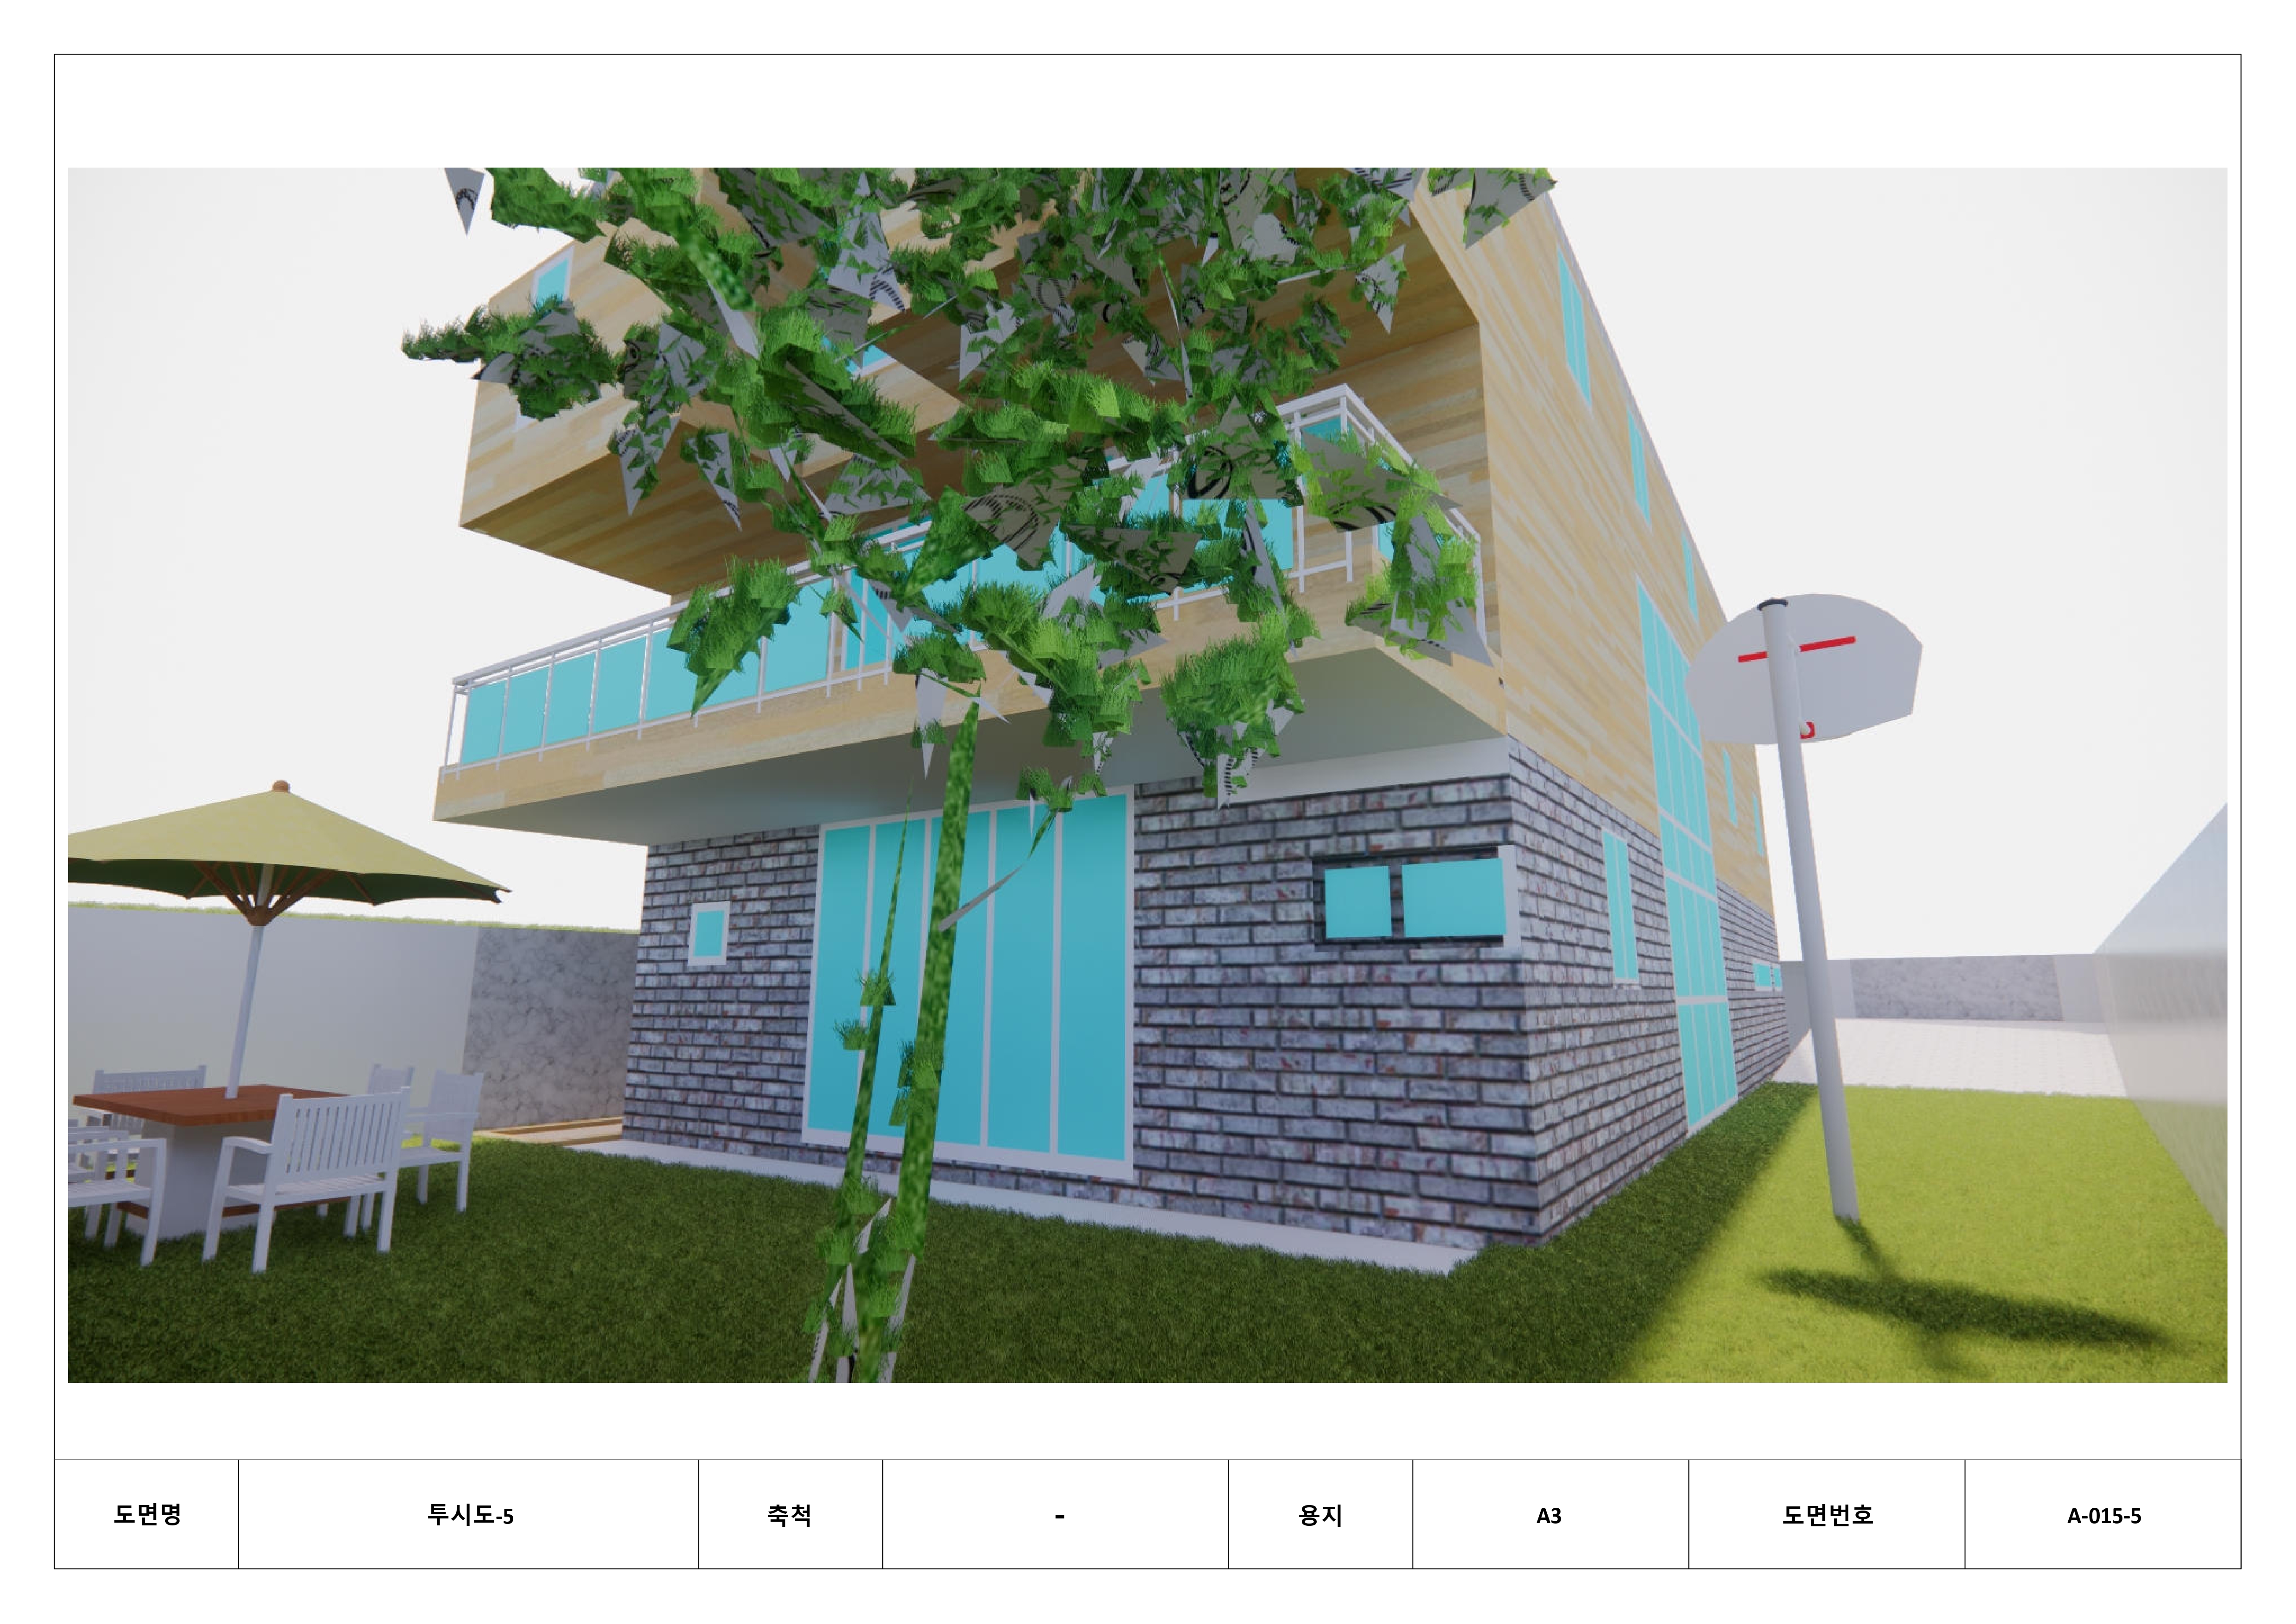
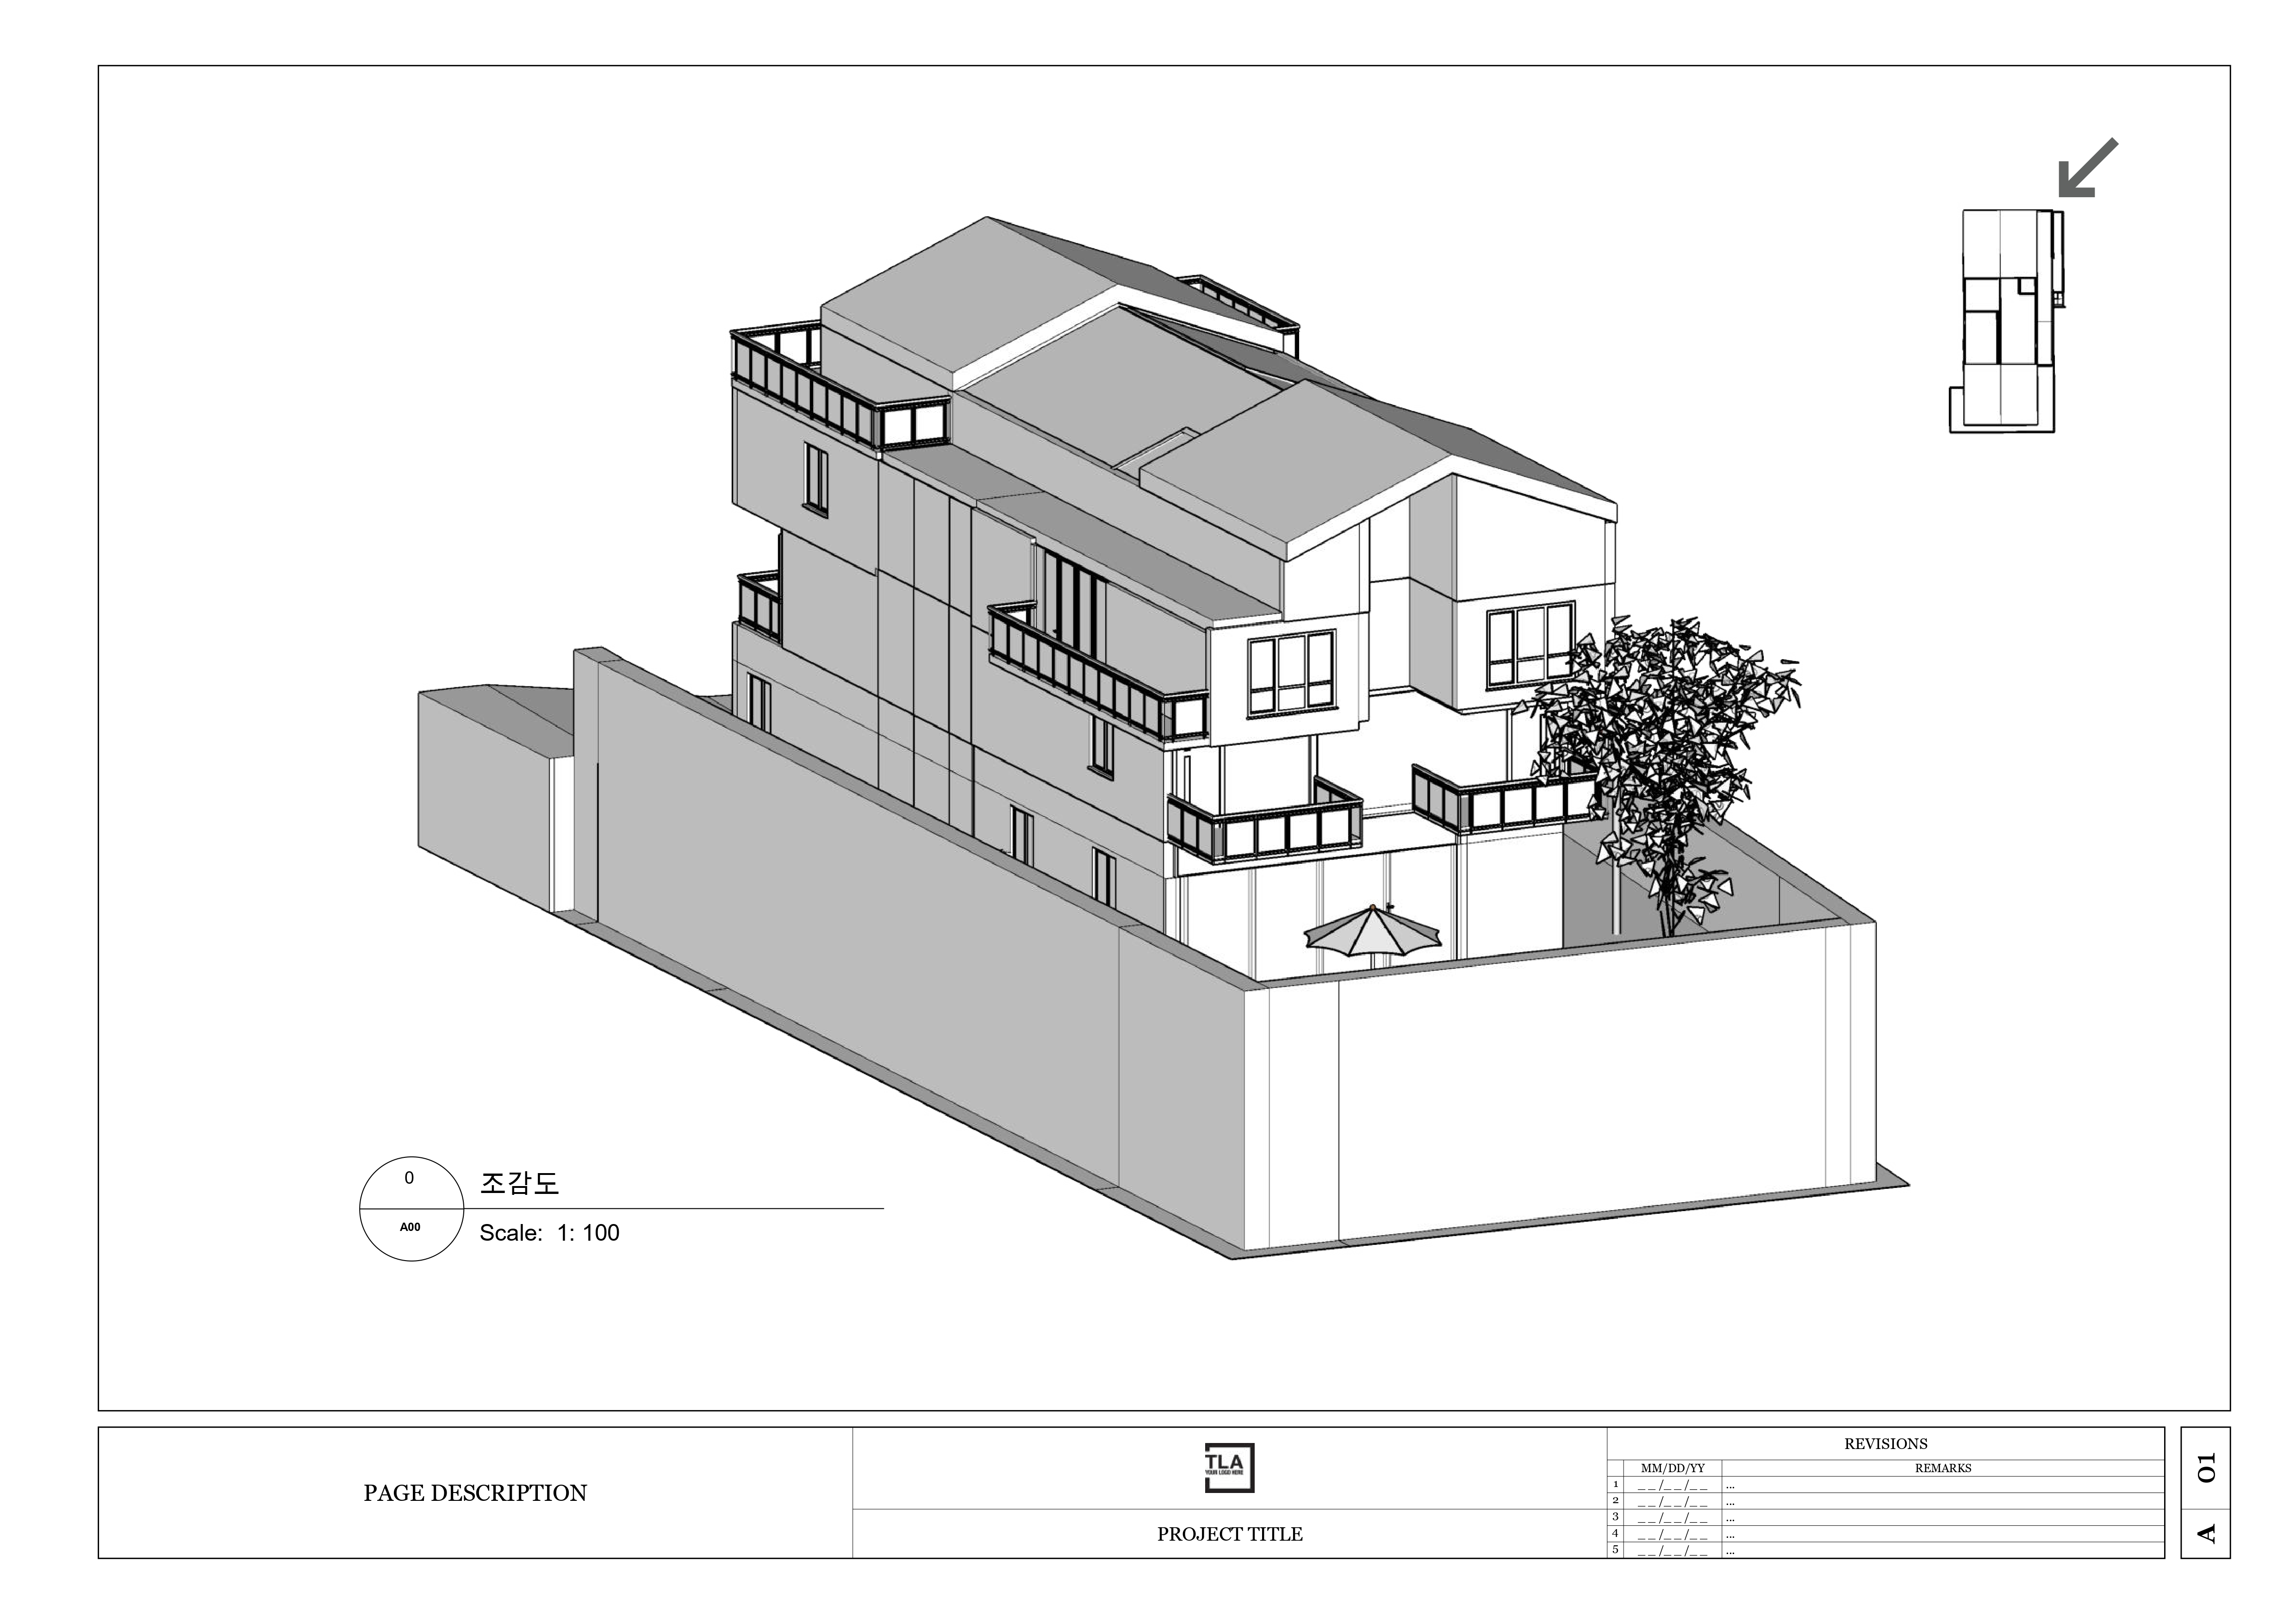
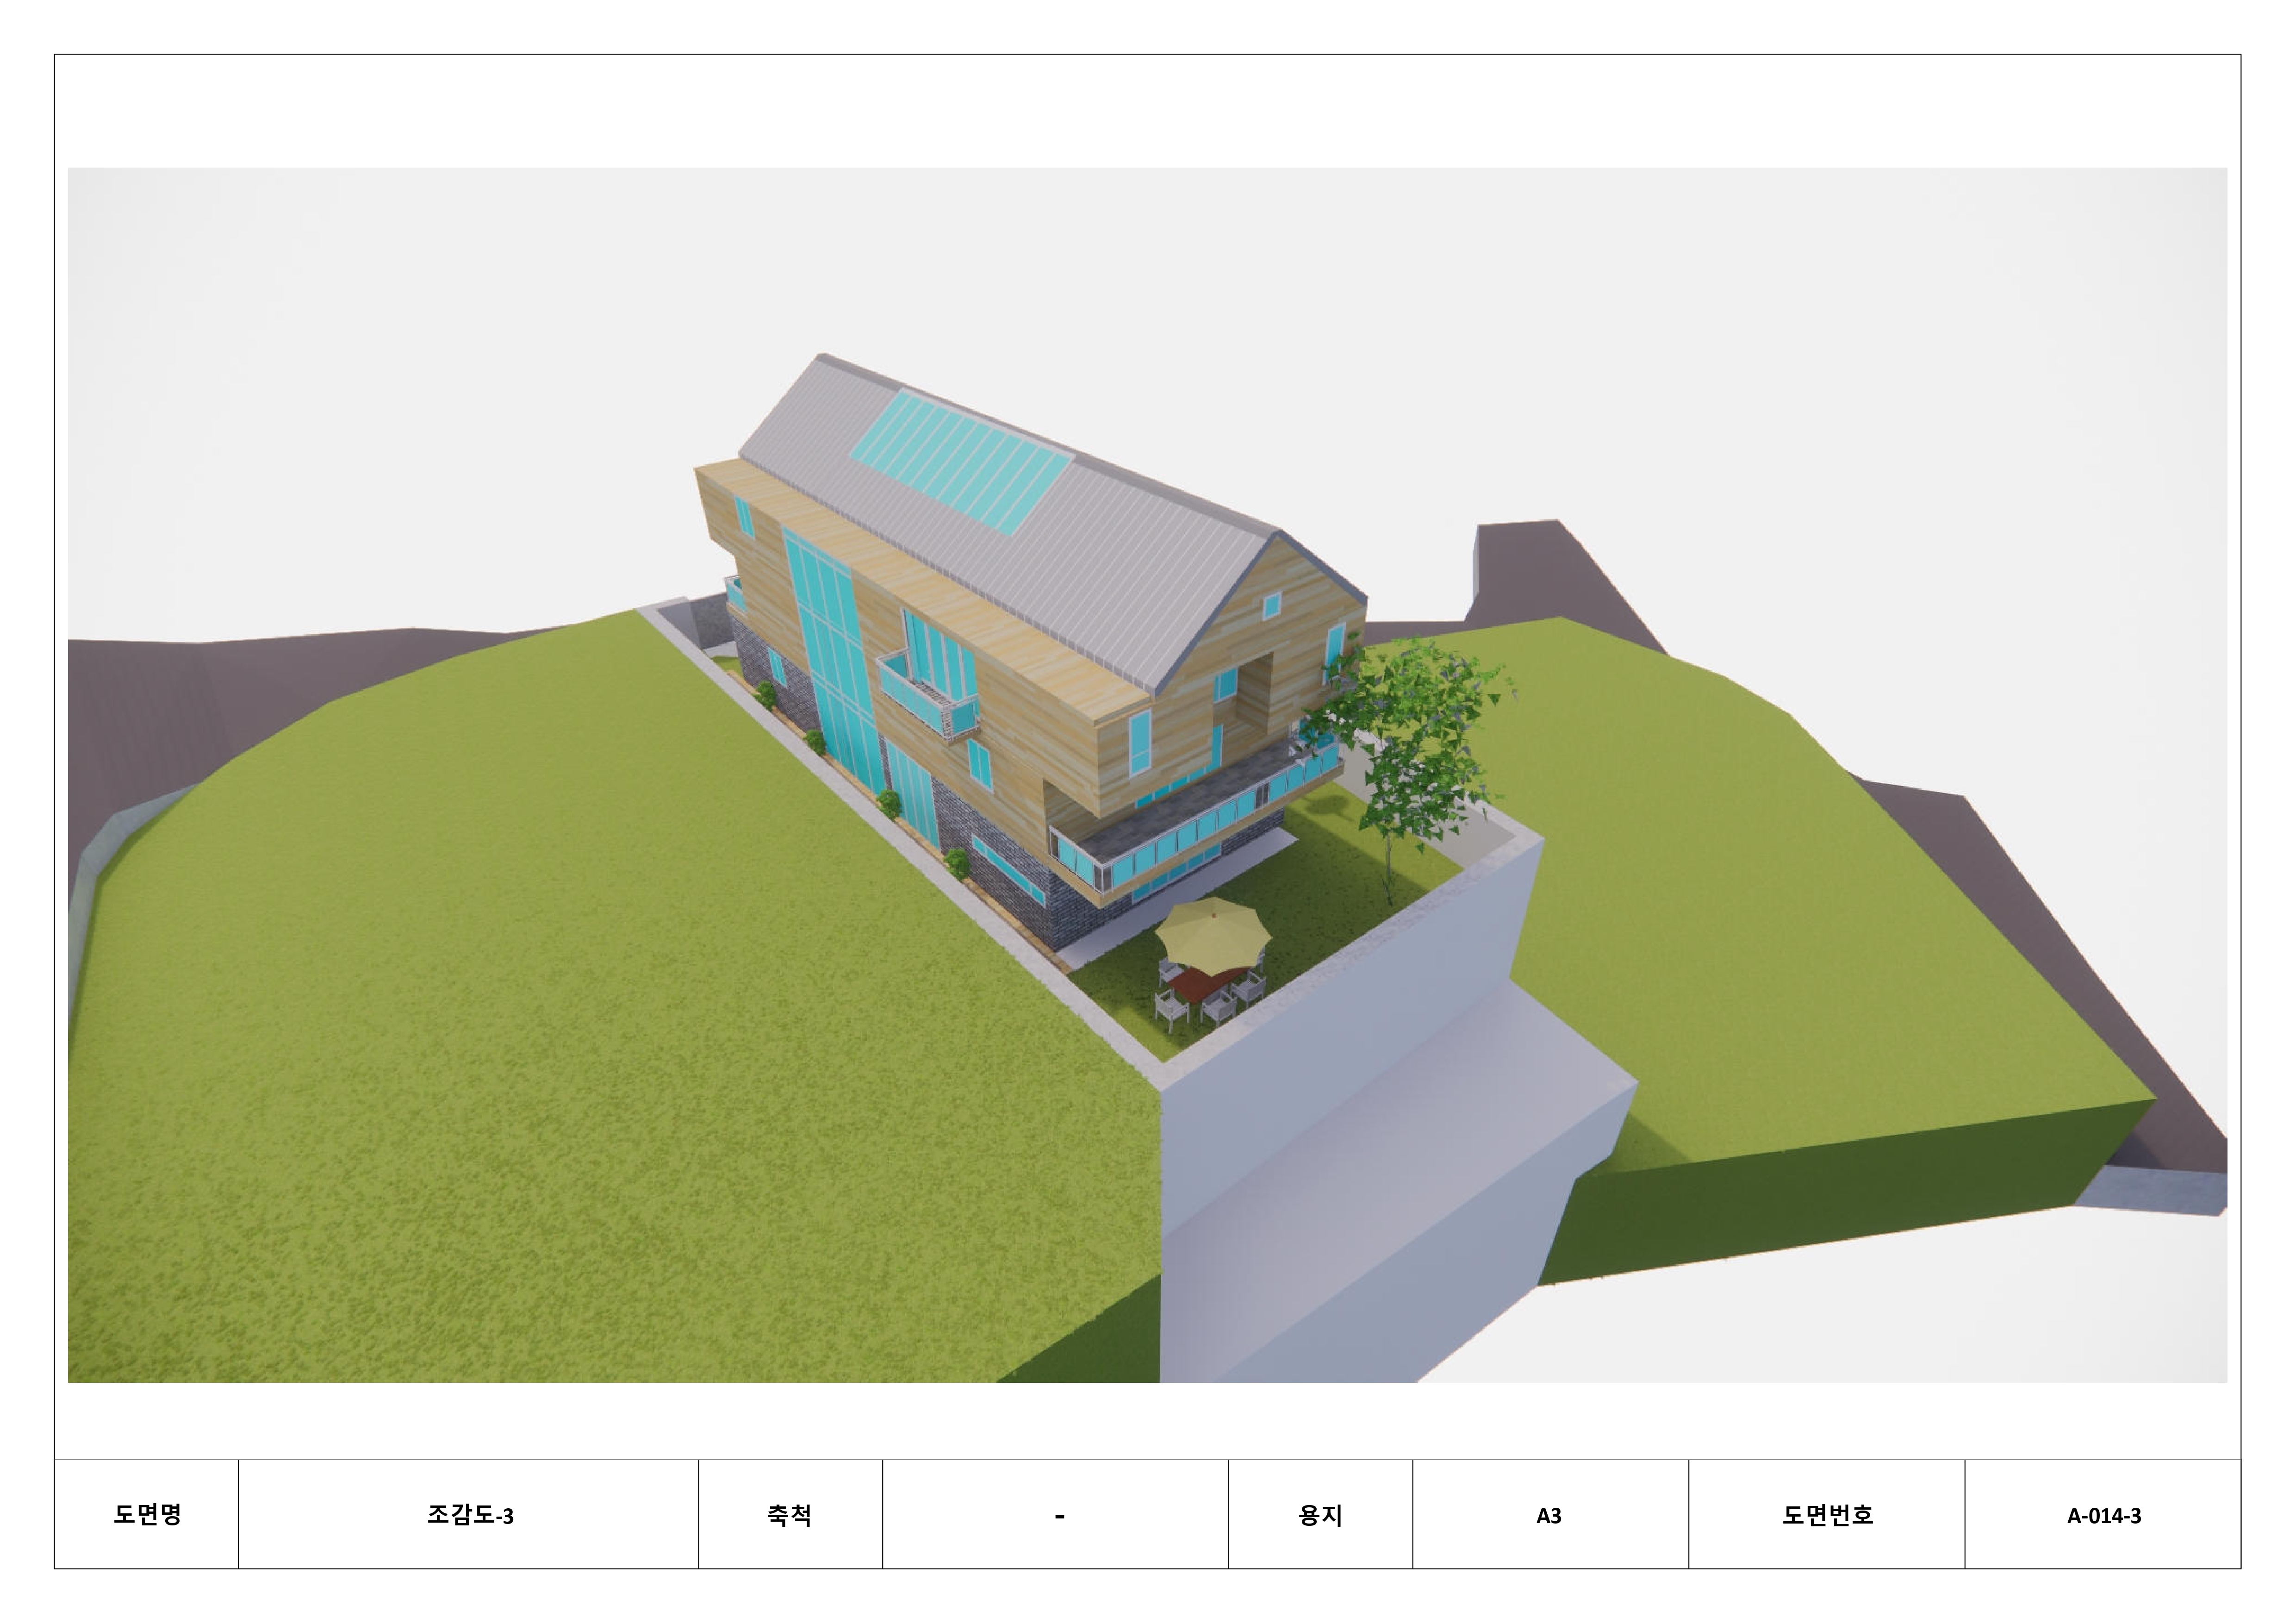
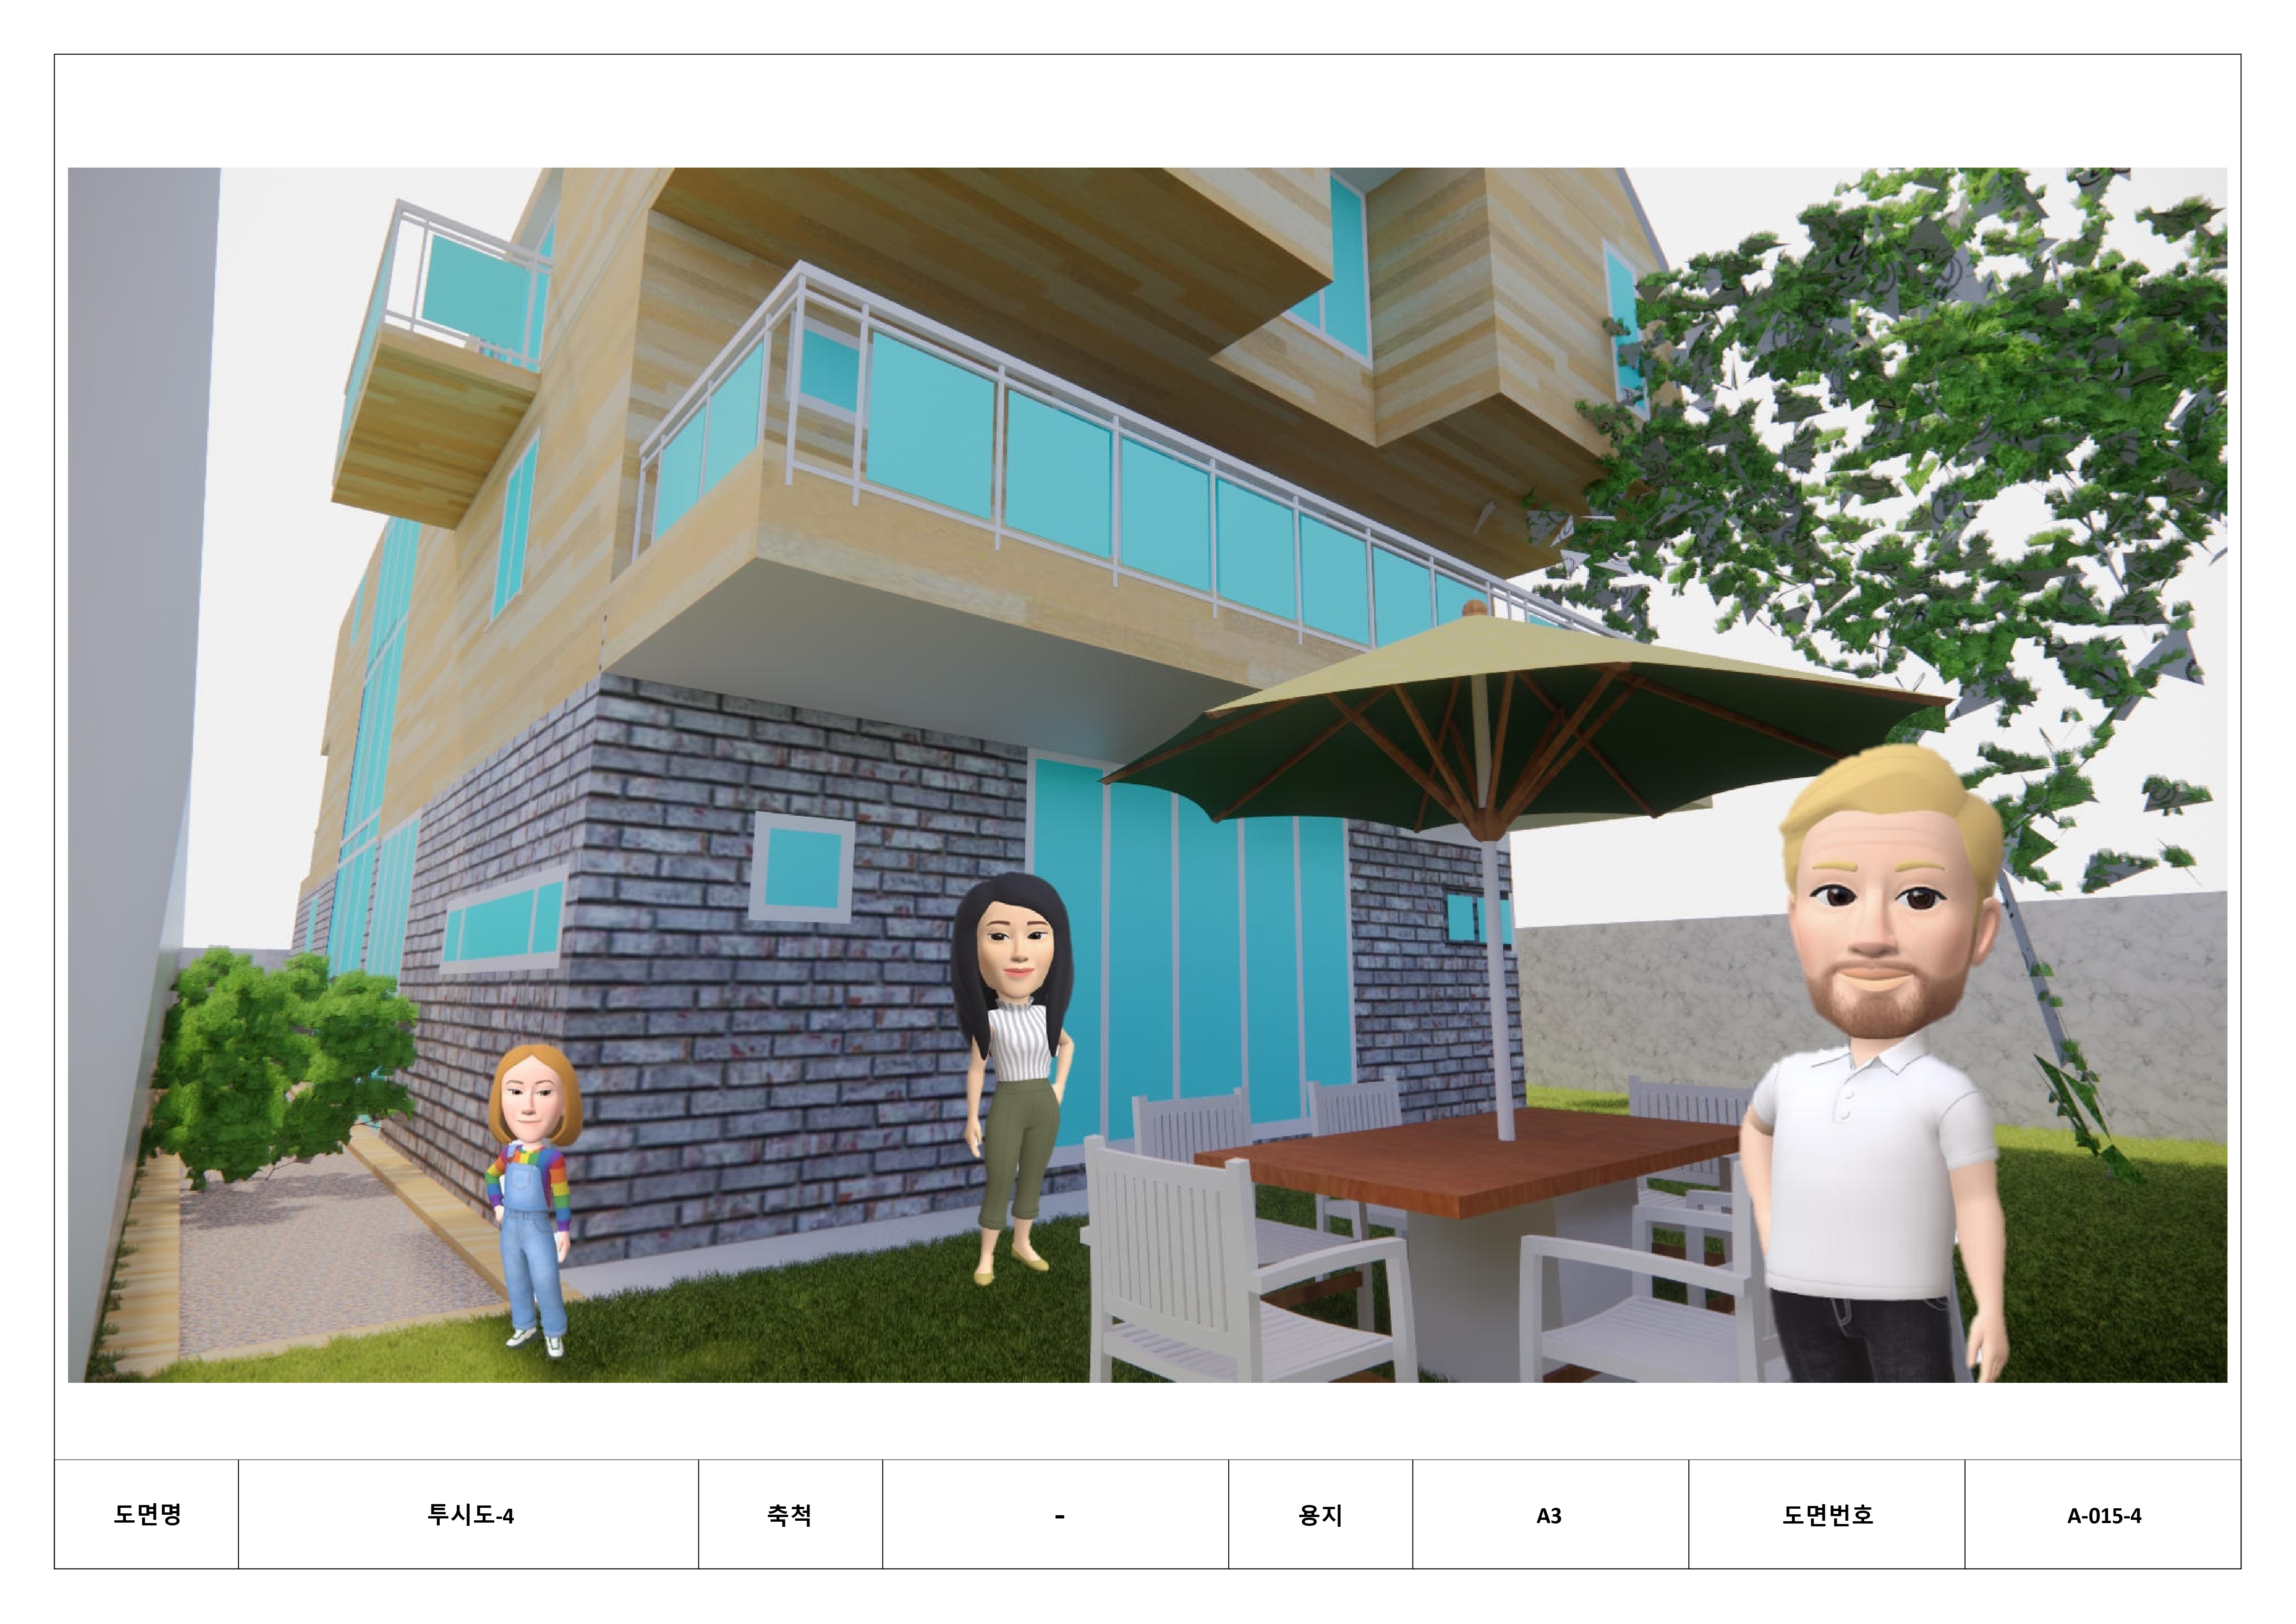
· Luxury Residential House Design in Itaewon-dong 258-66, Seoul, Korea
ARE3080. Architectural Integrated Design I | Hanyang University
📆 Mar. 2022 - Jun.2022
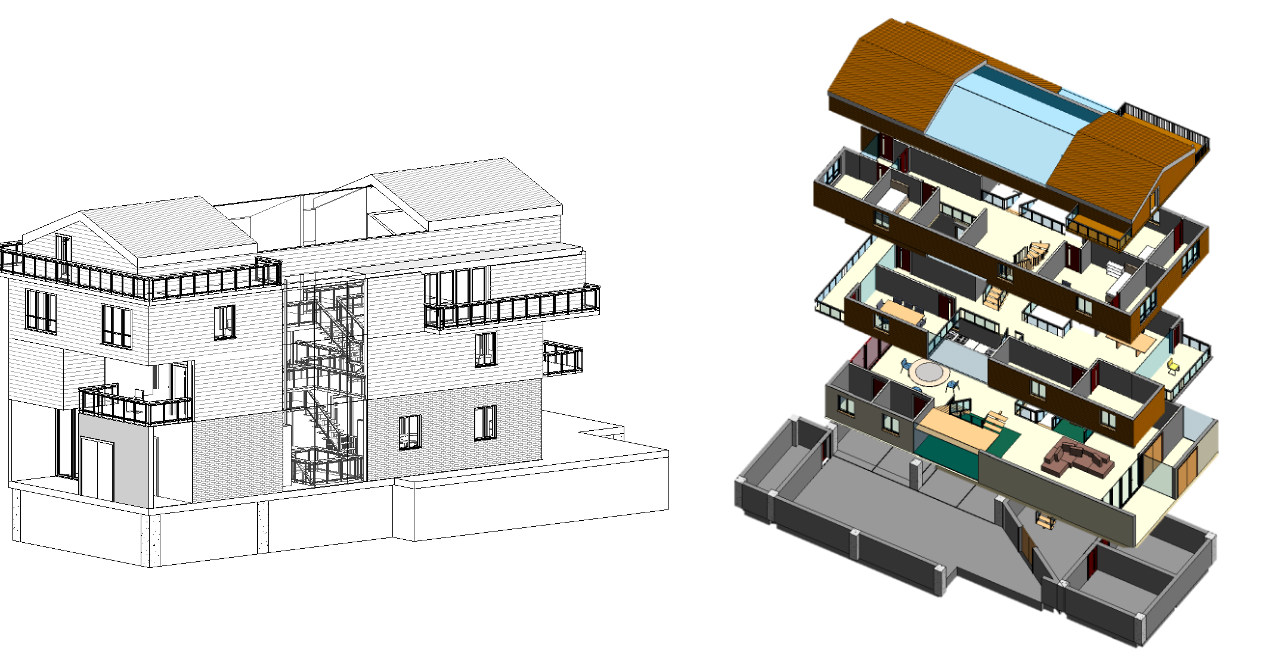
Architectural design of a luxury family residence in Itaewon reflecting the lifestyle needs of a five-member household, using AutoCAD, Revit, and SketchUp for site analysis, legal review, and 3D visualization.
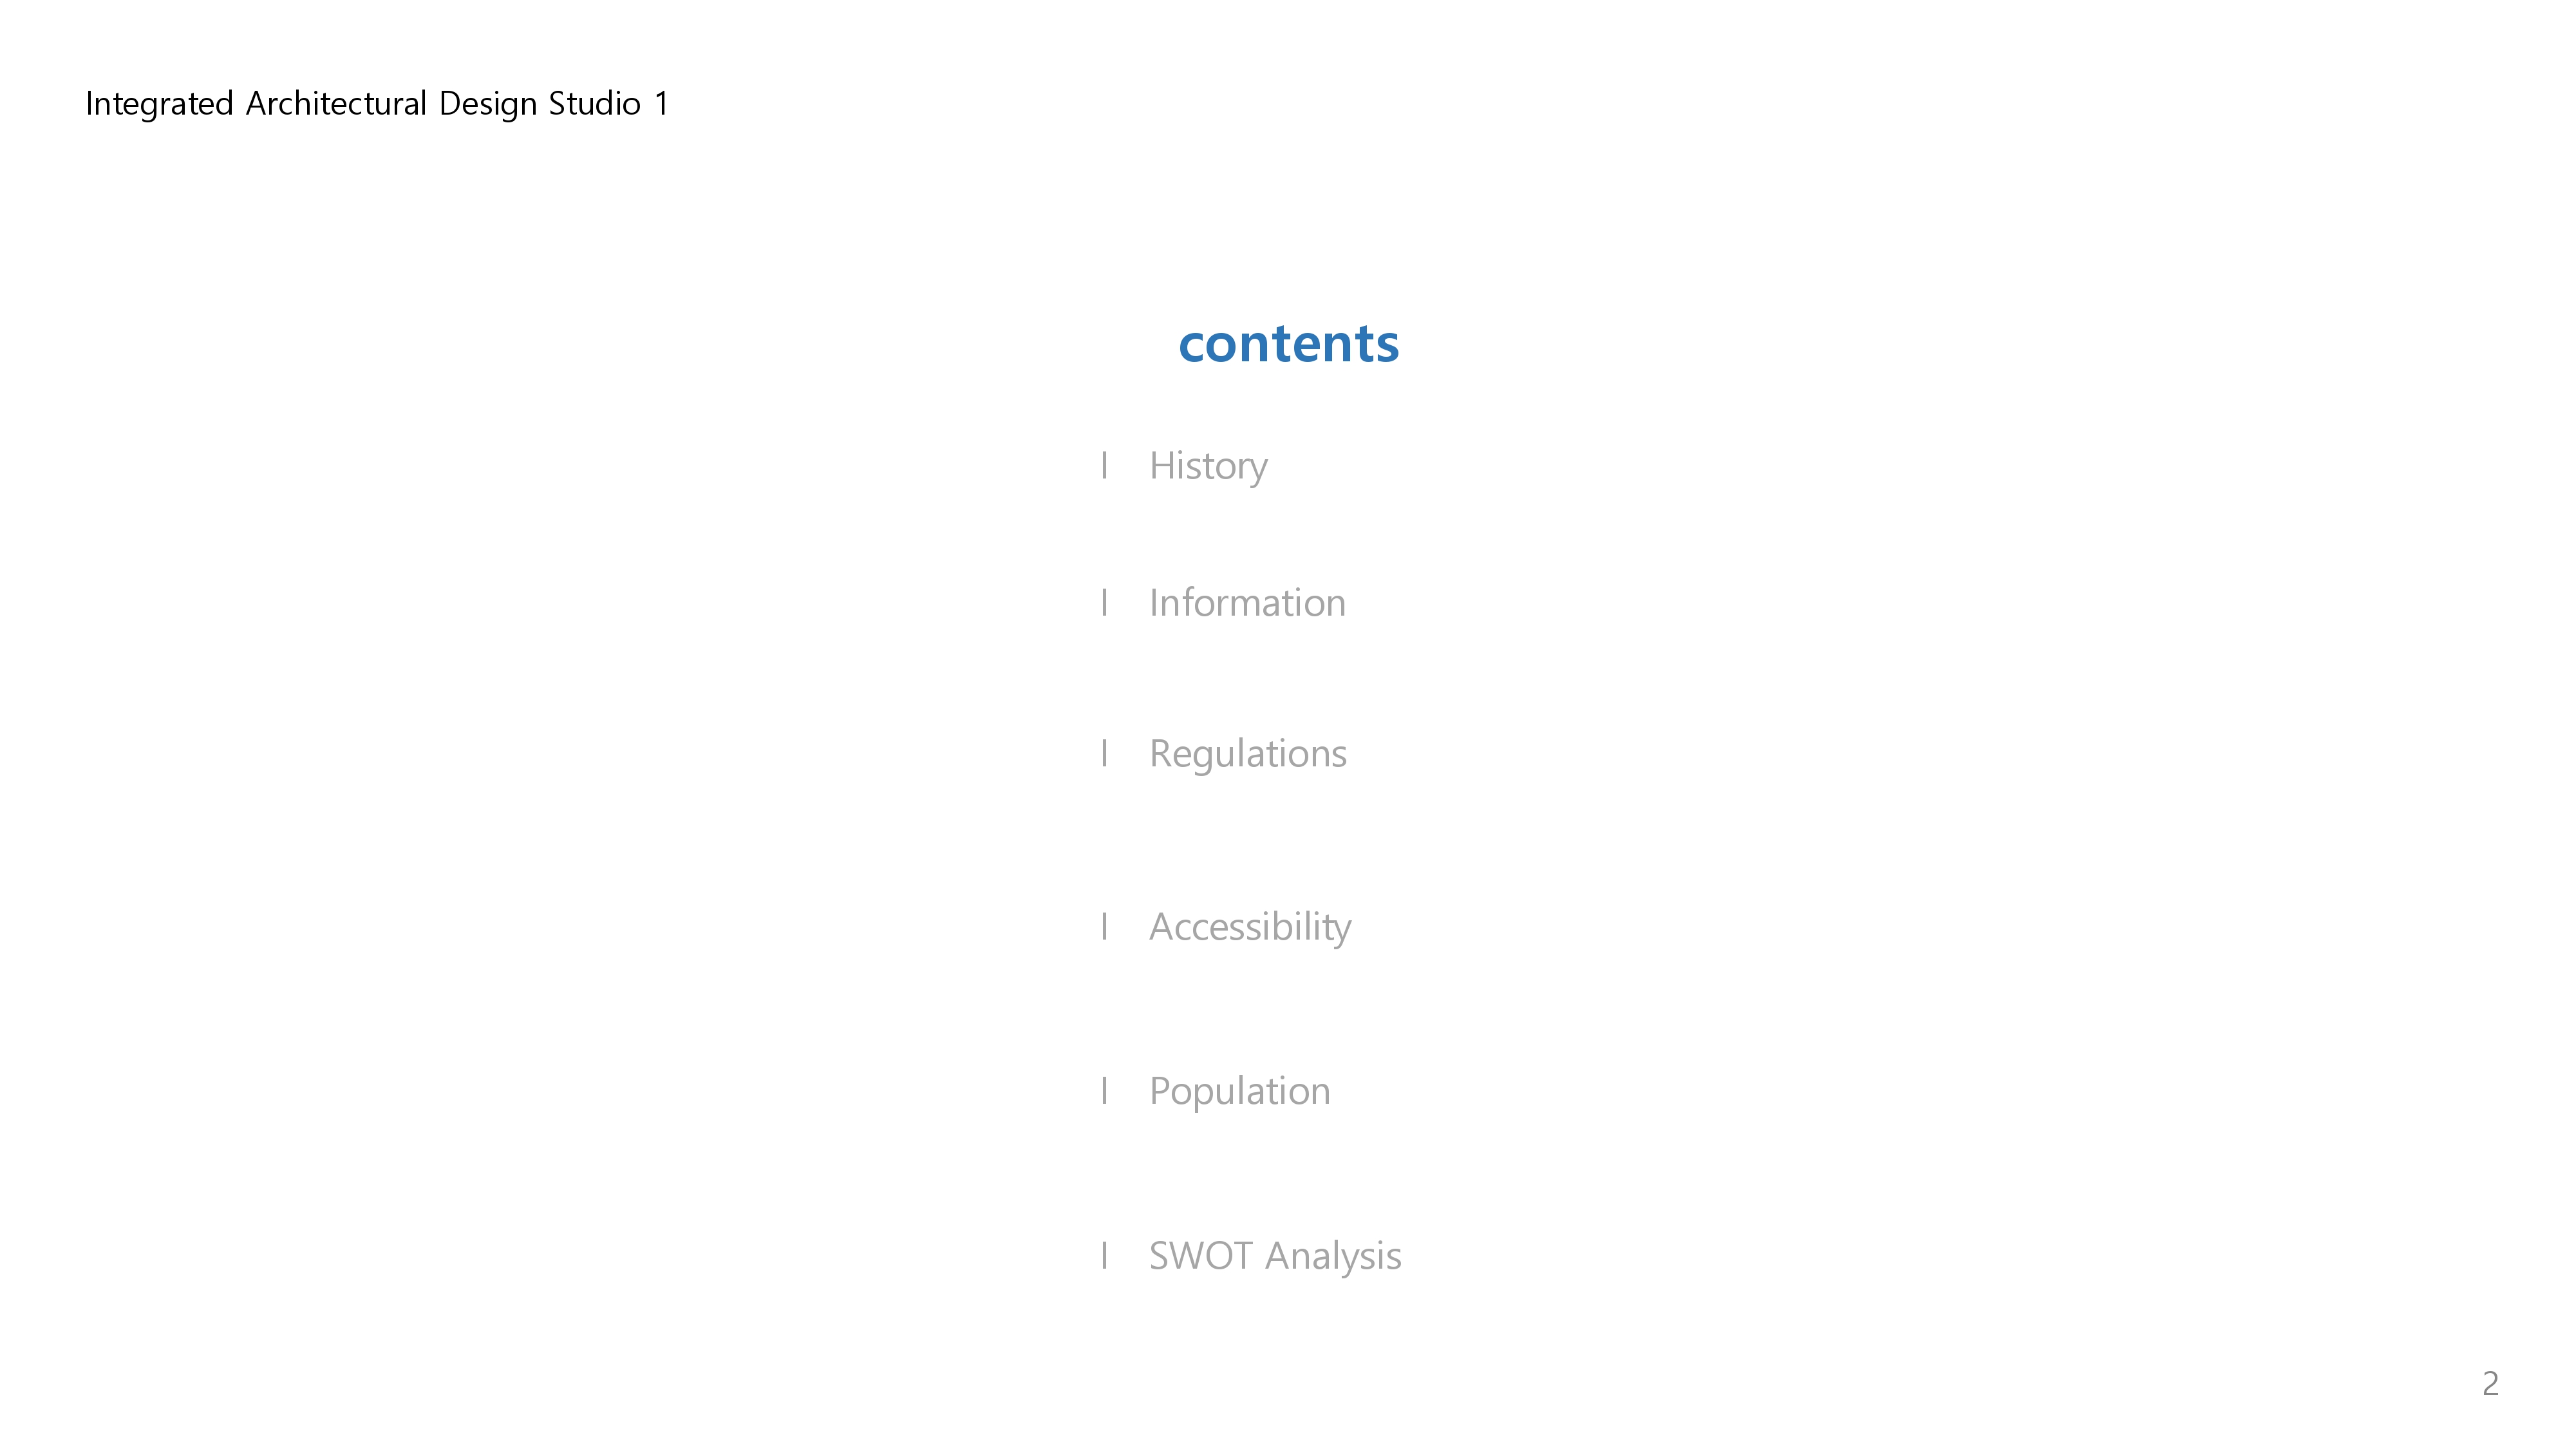
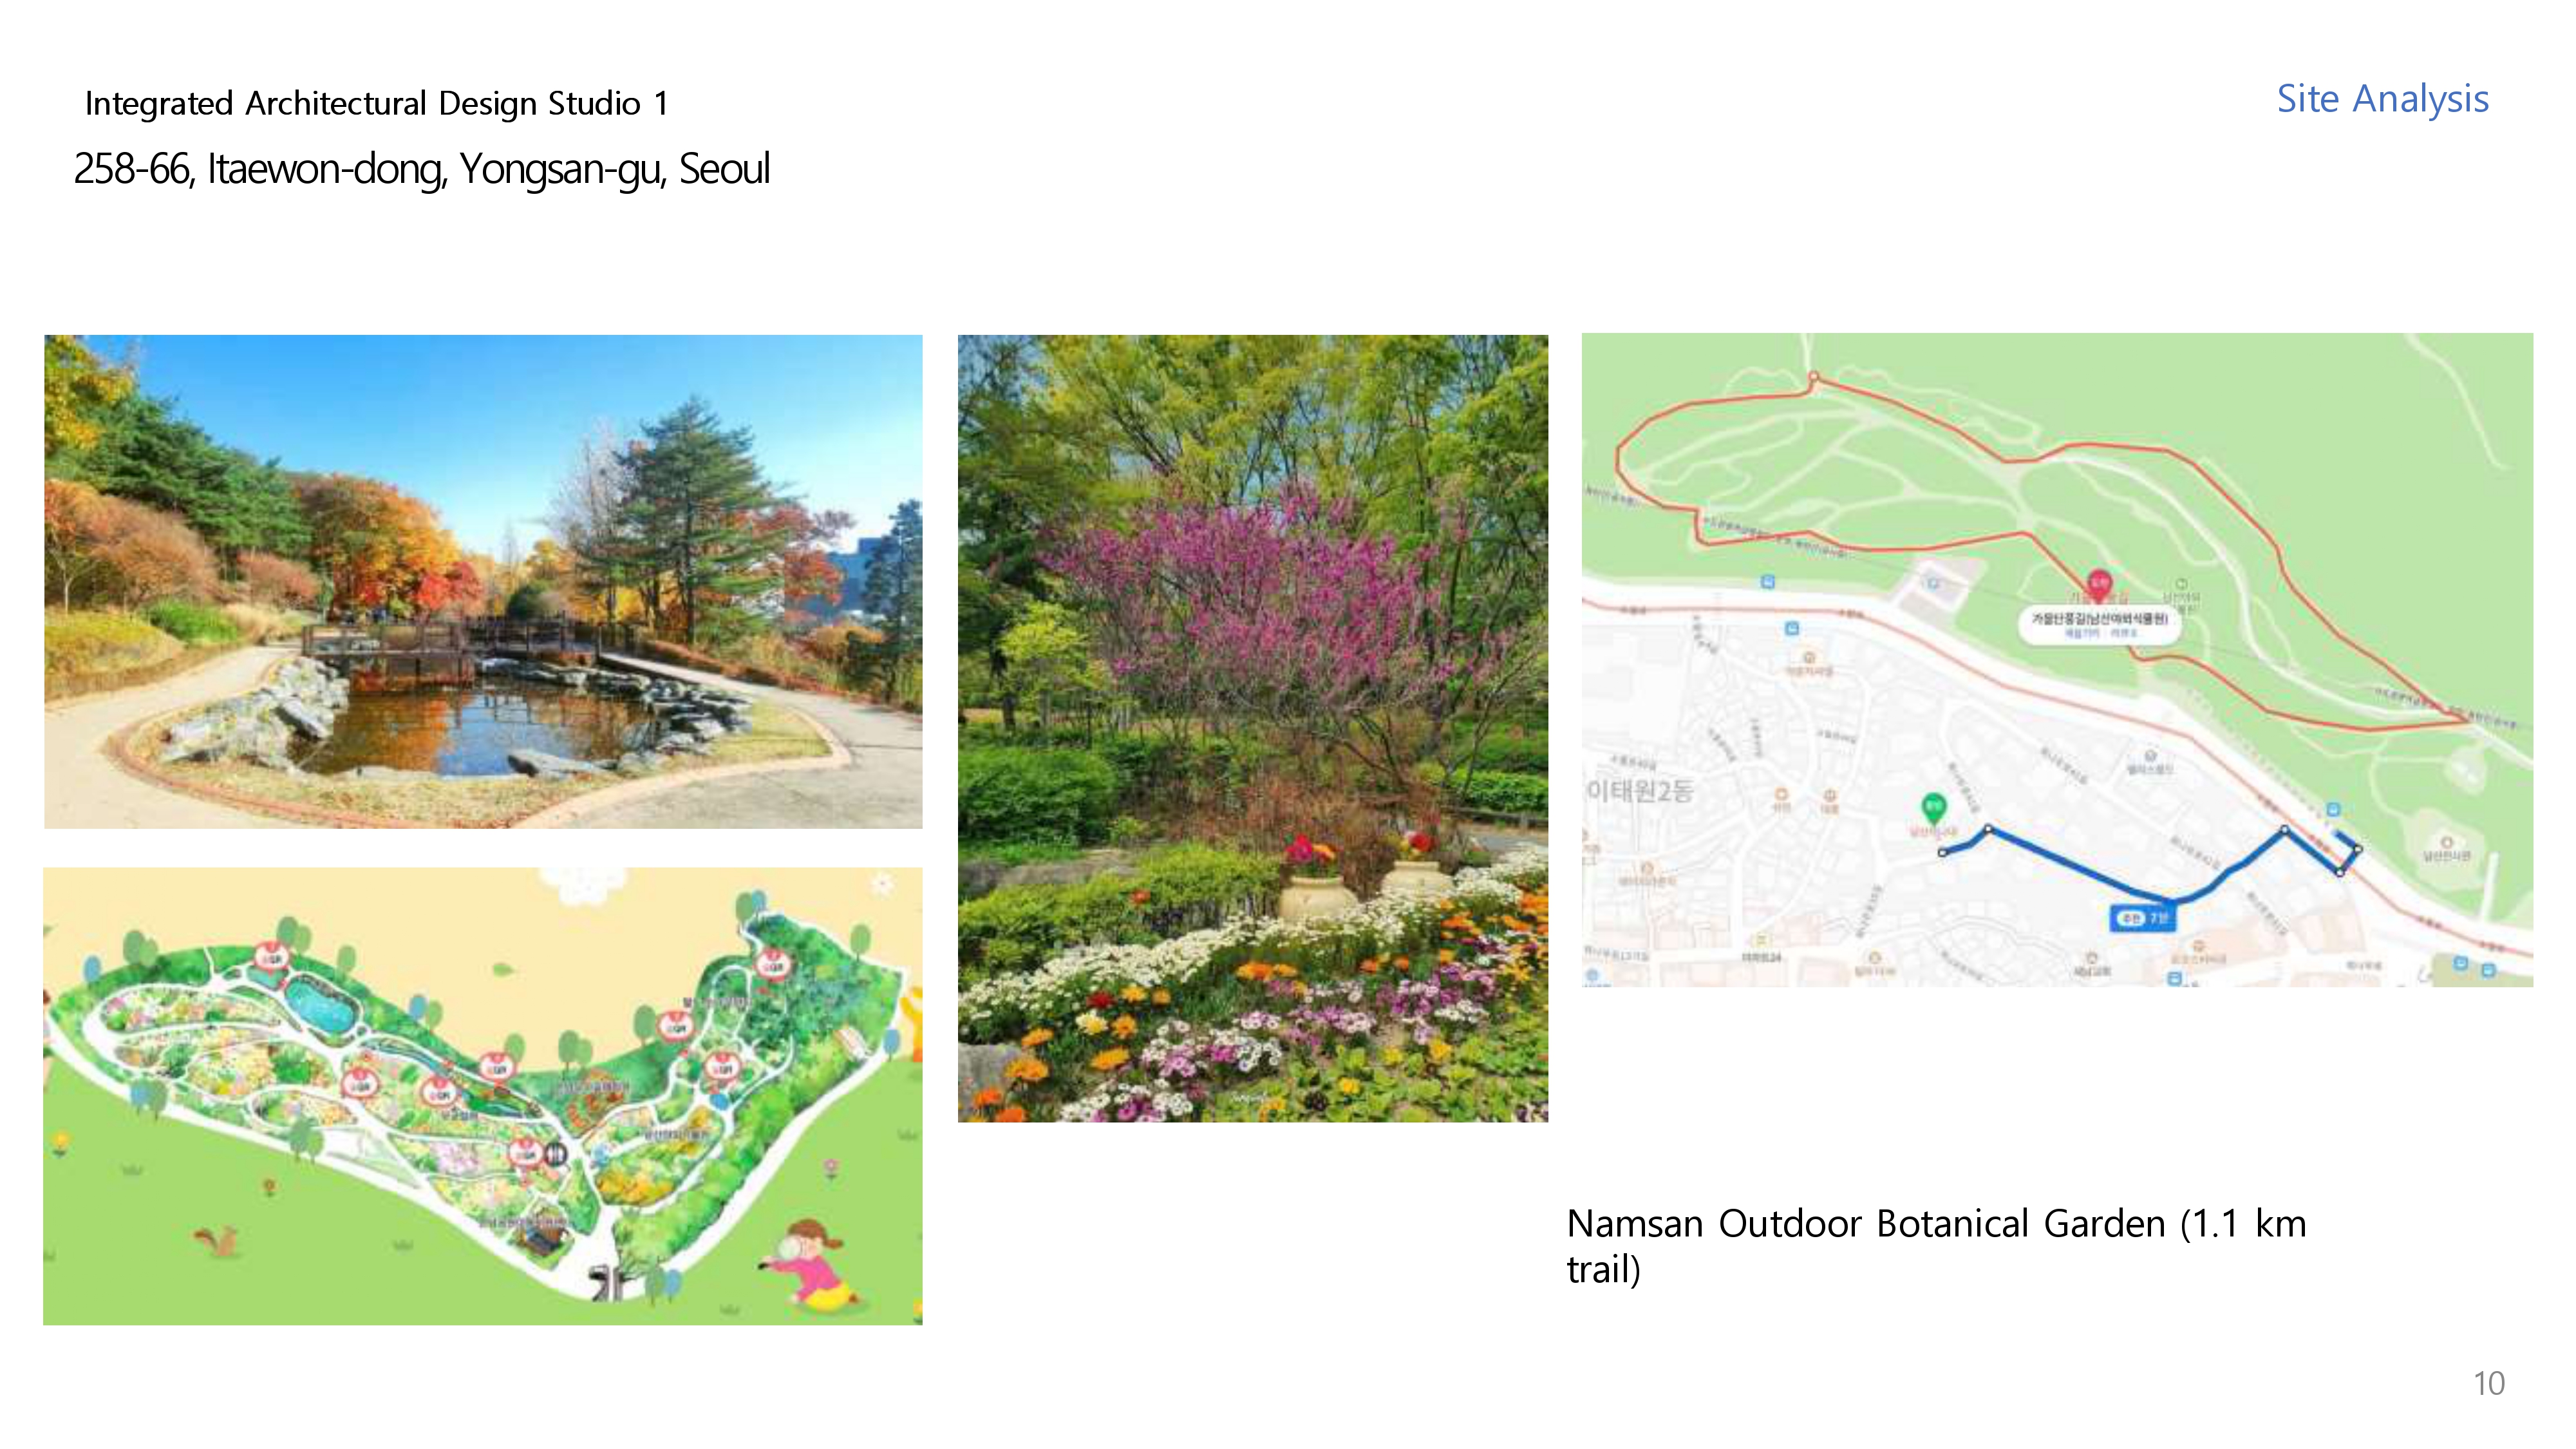
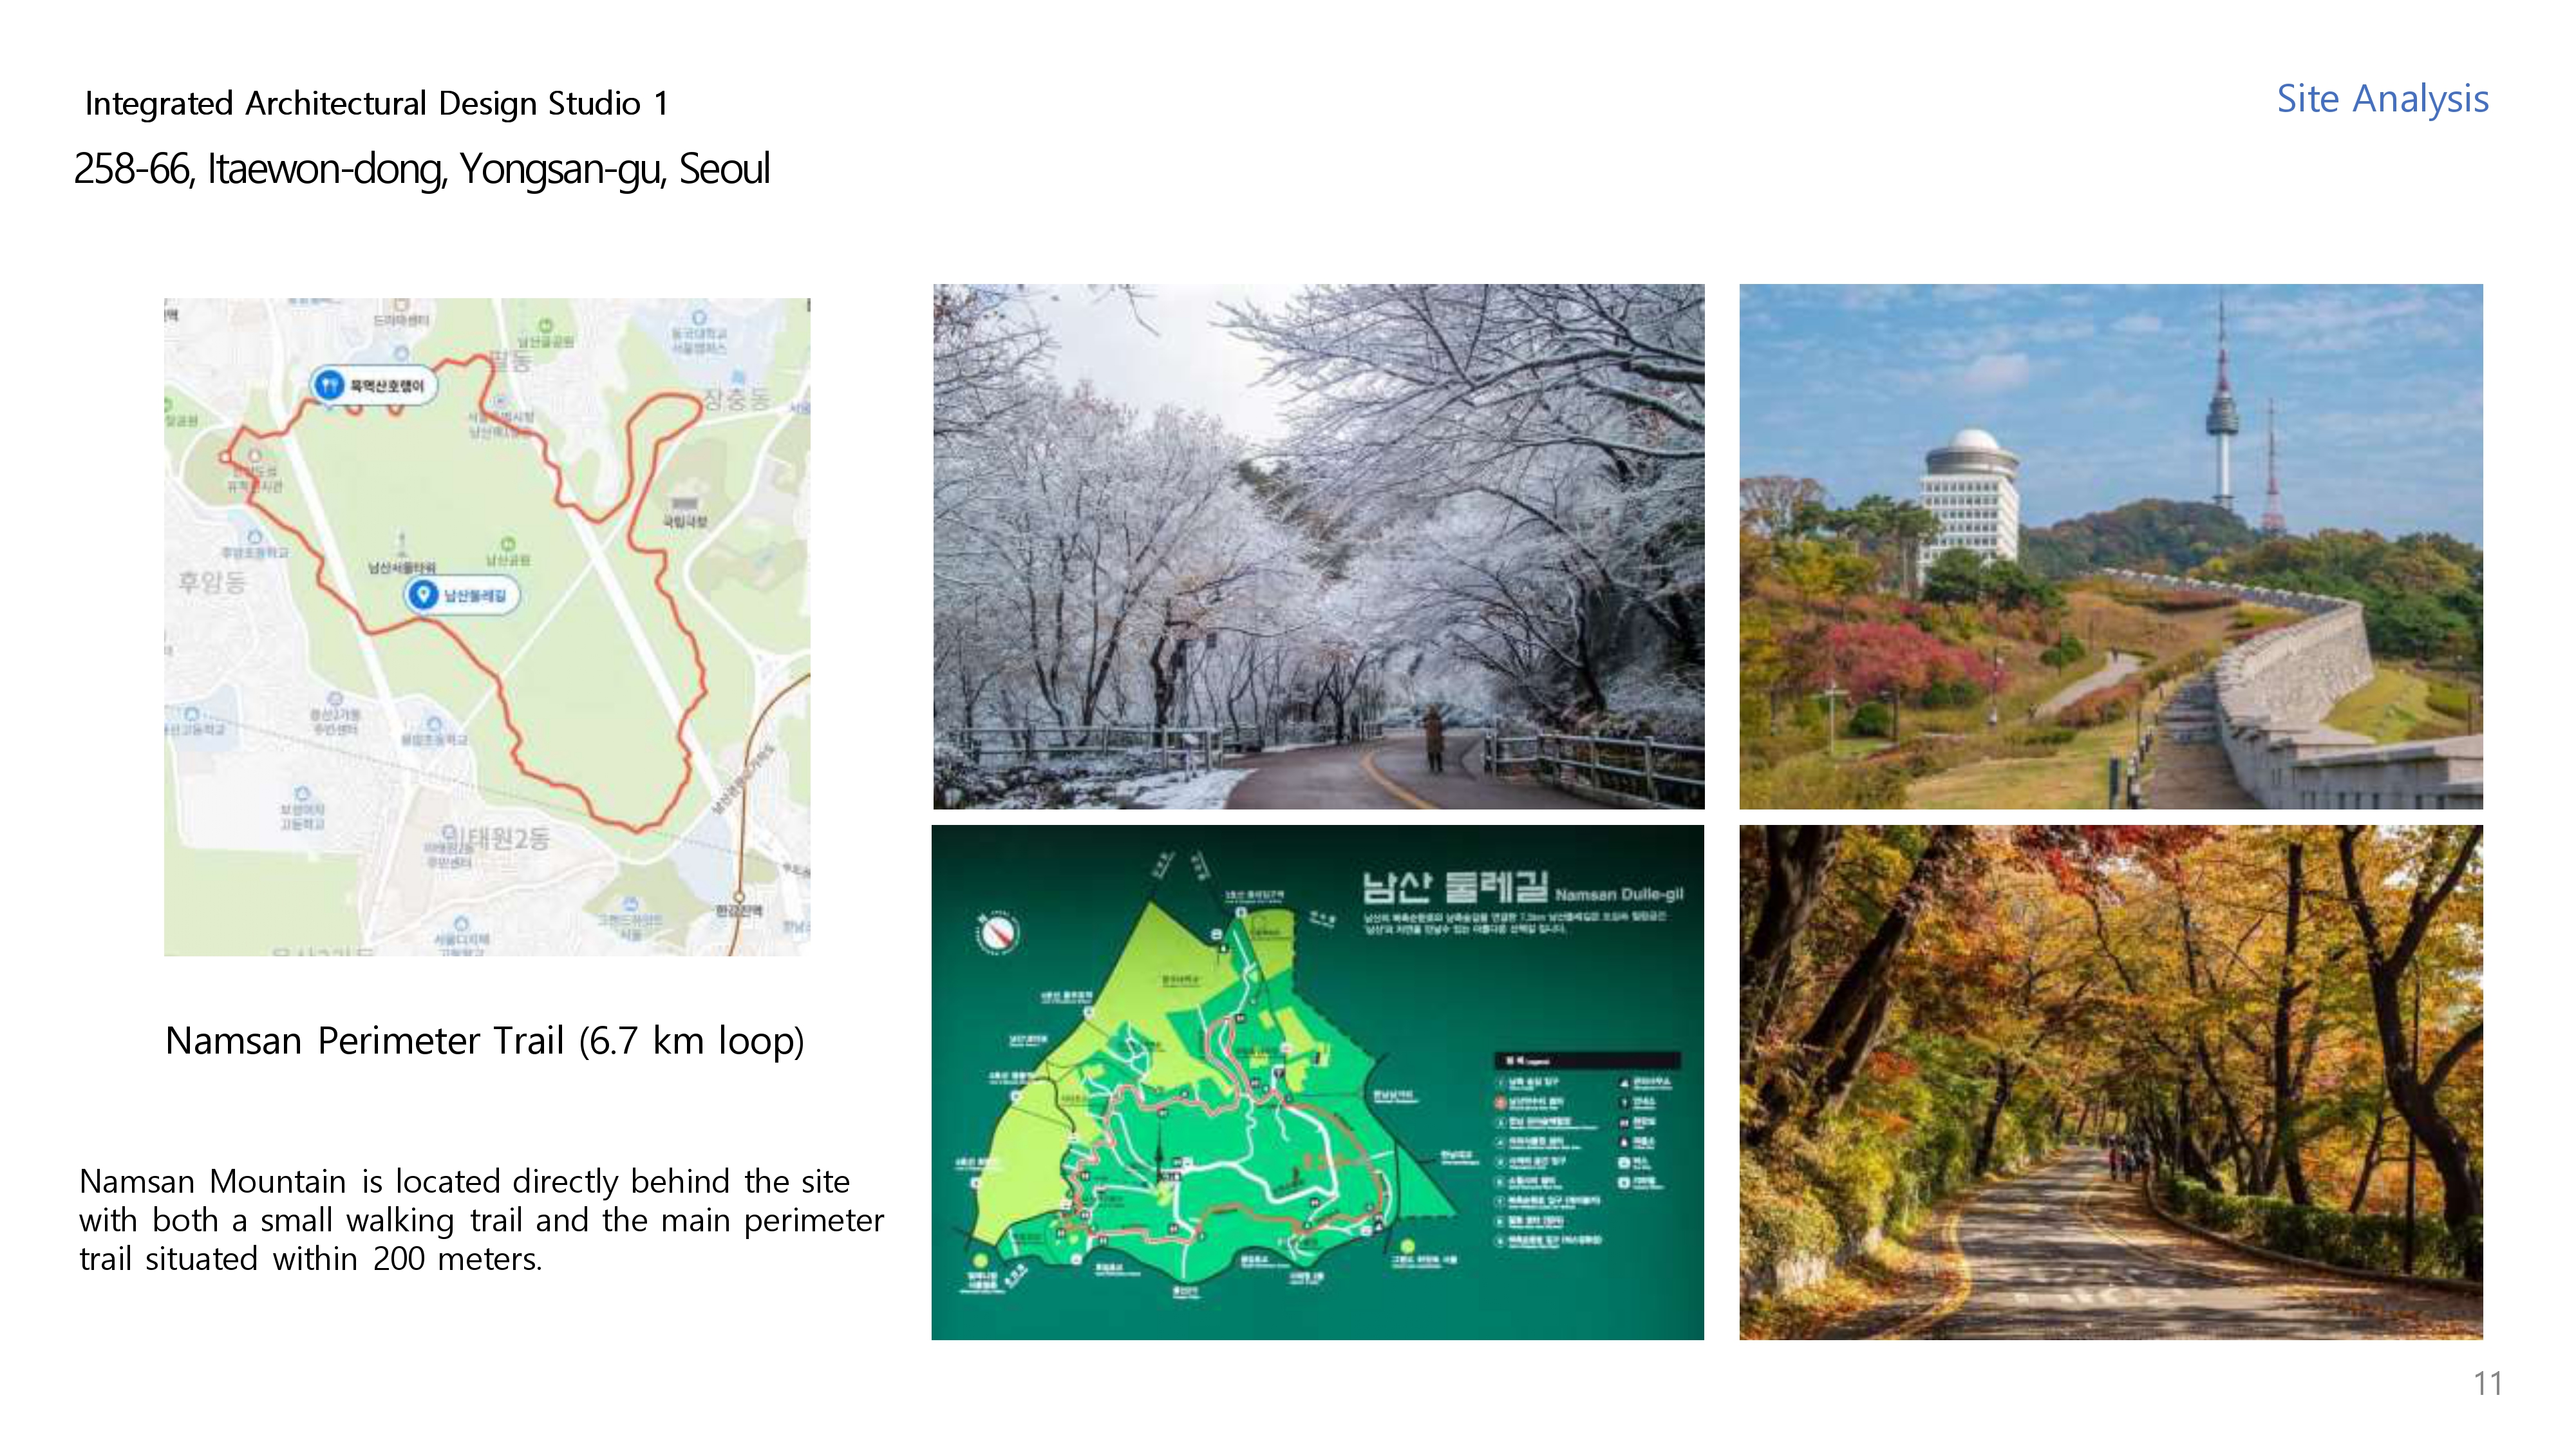
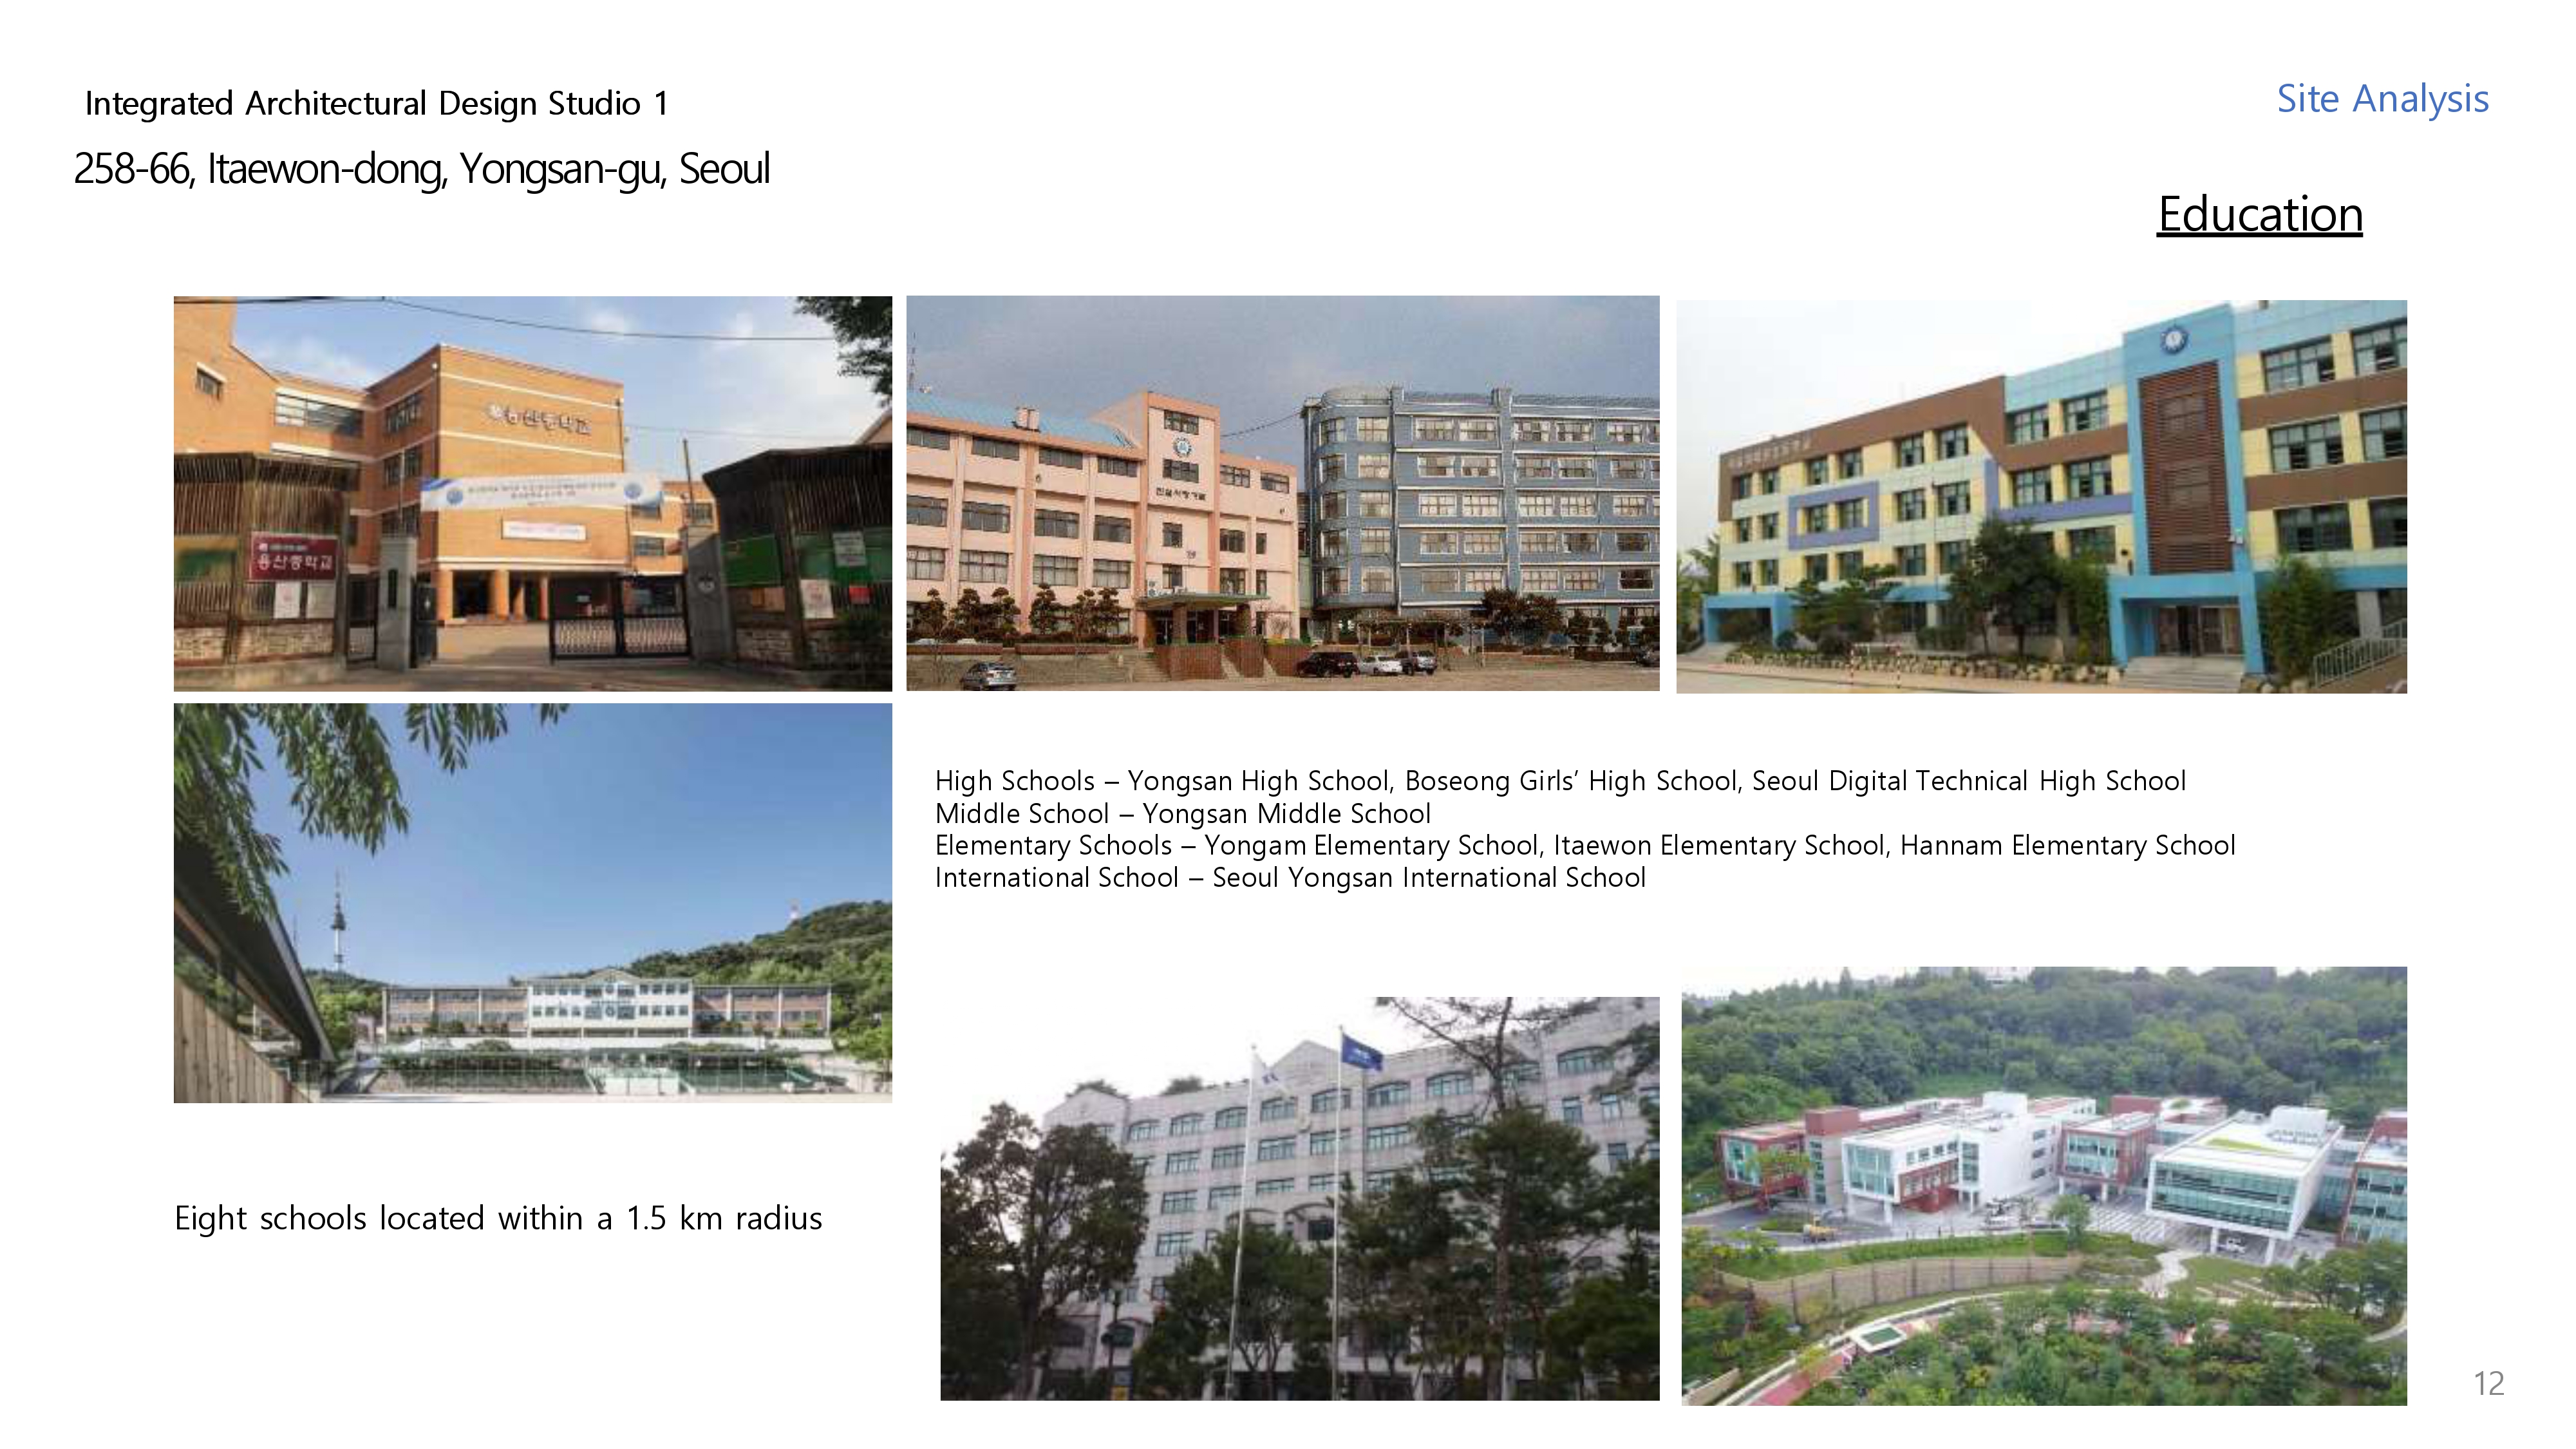
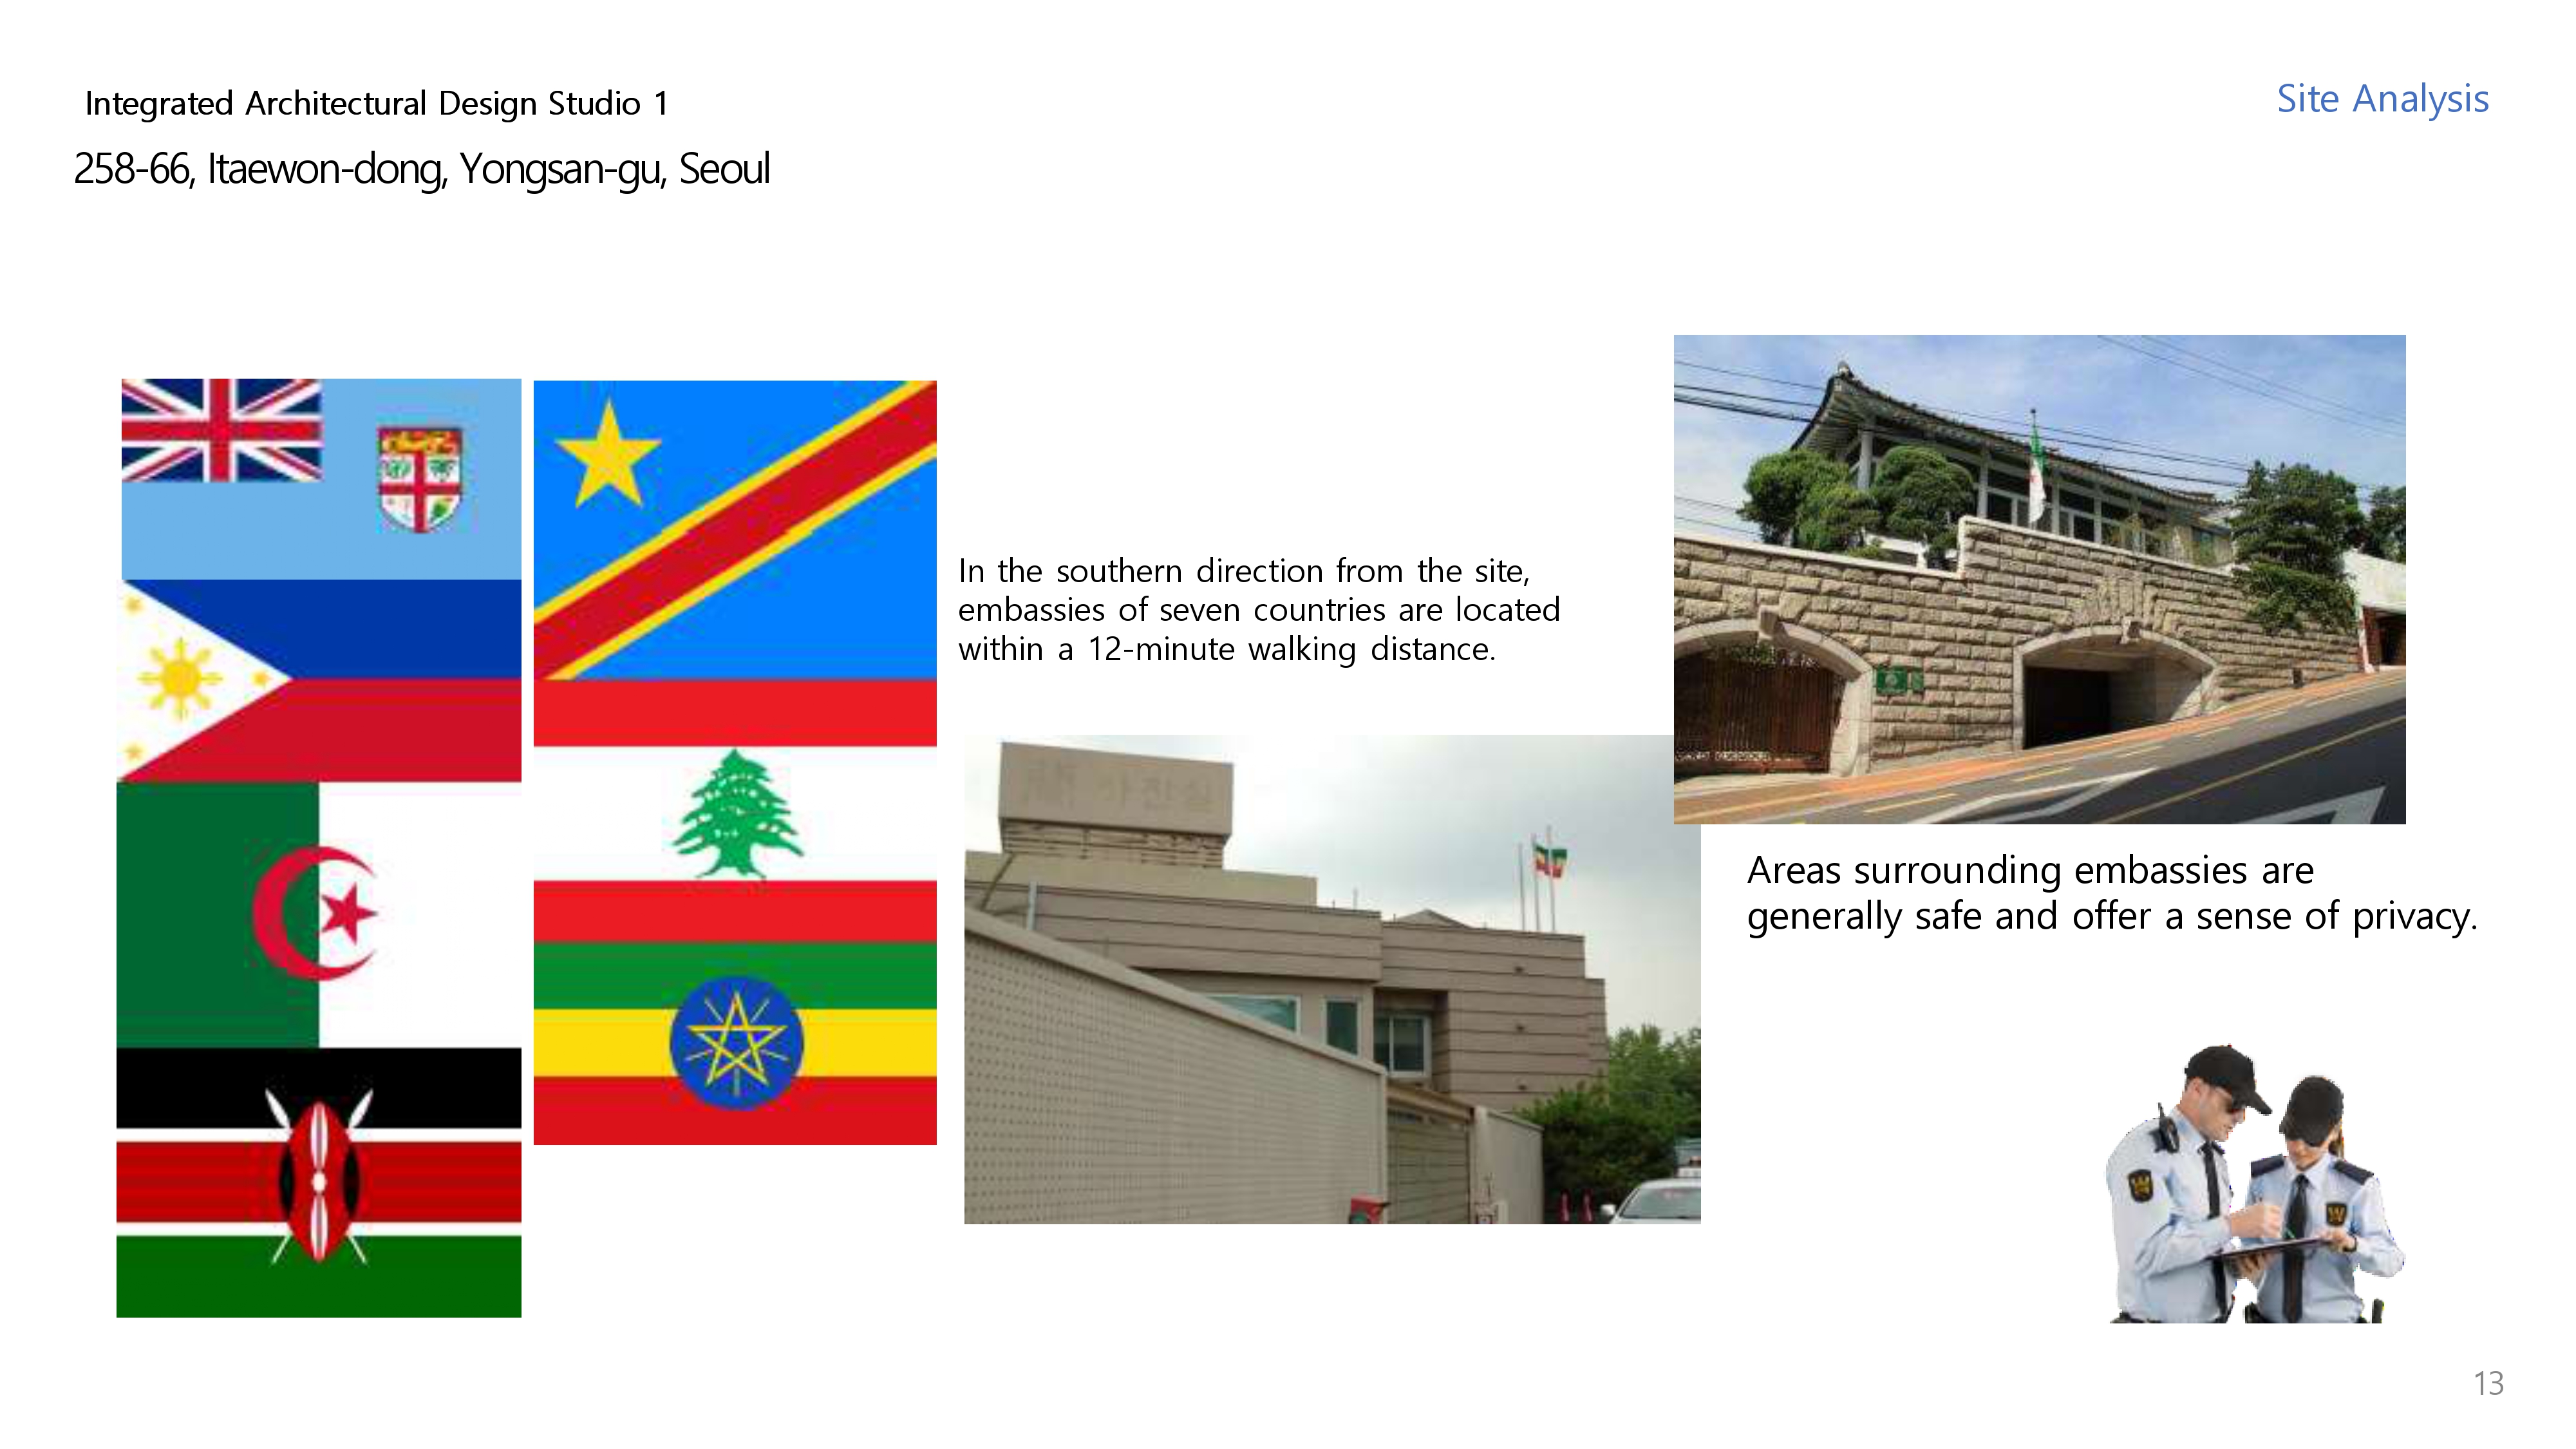
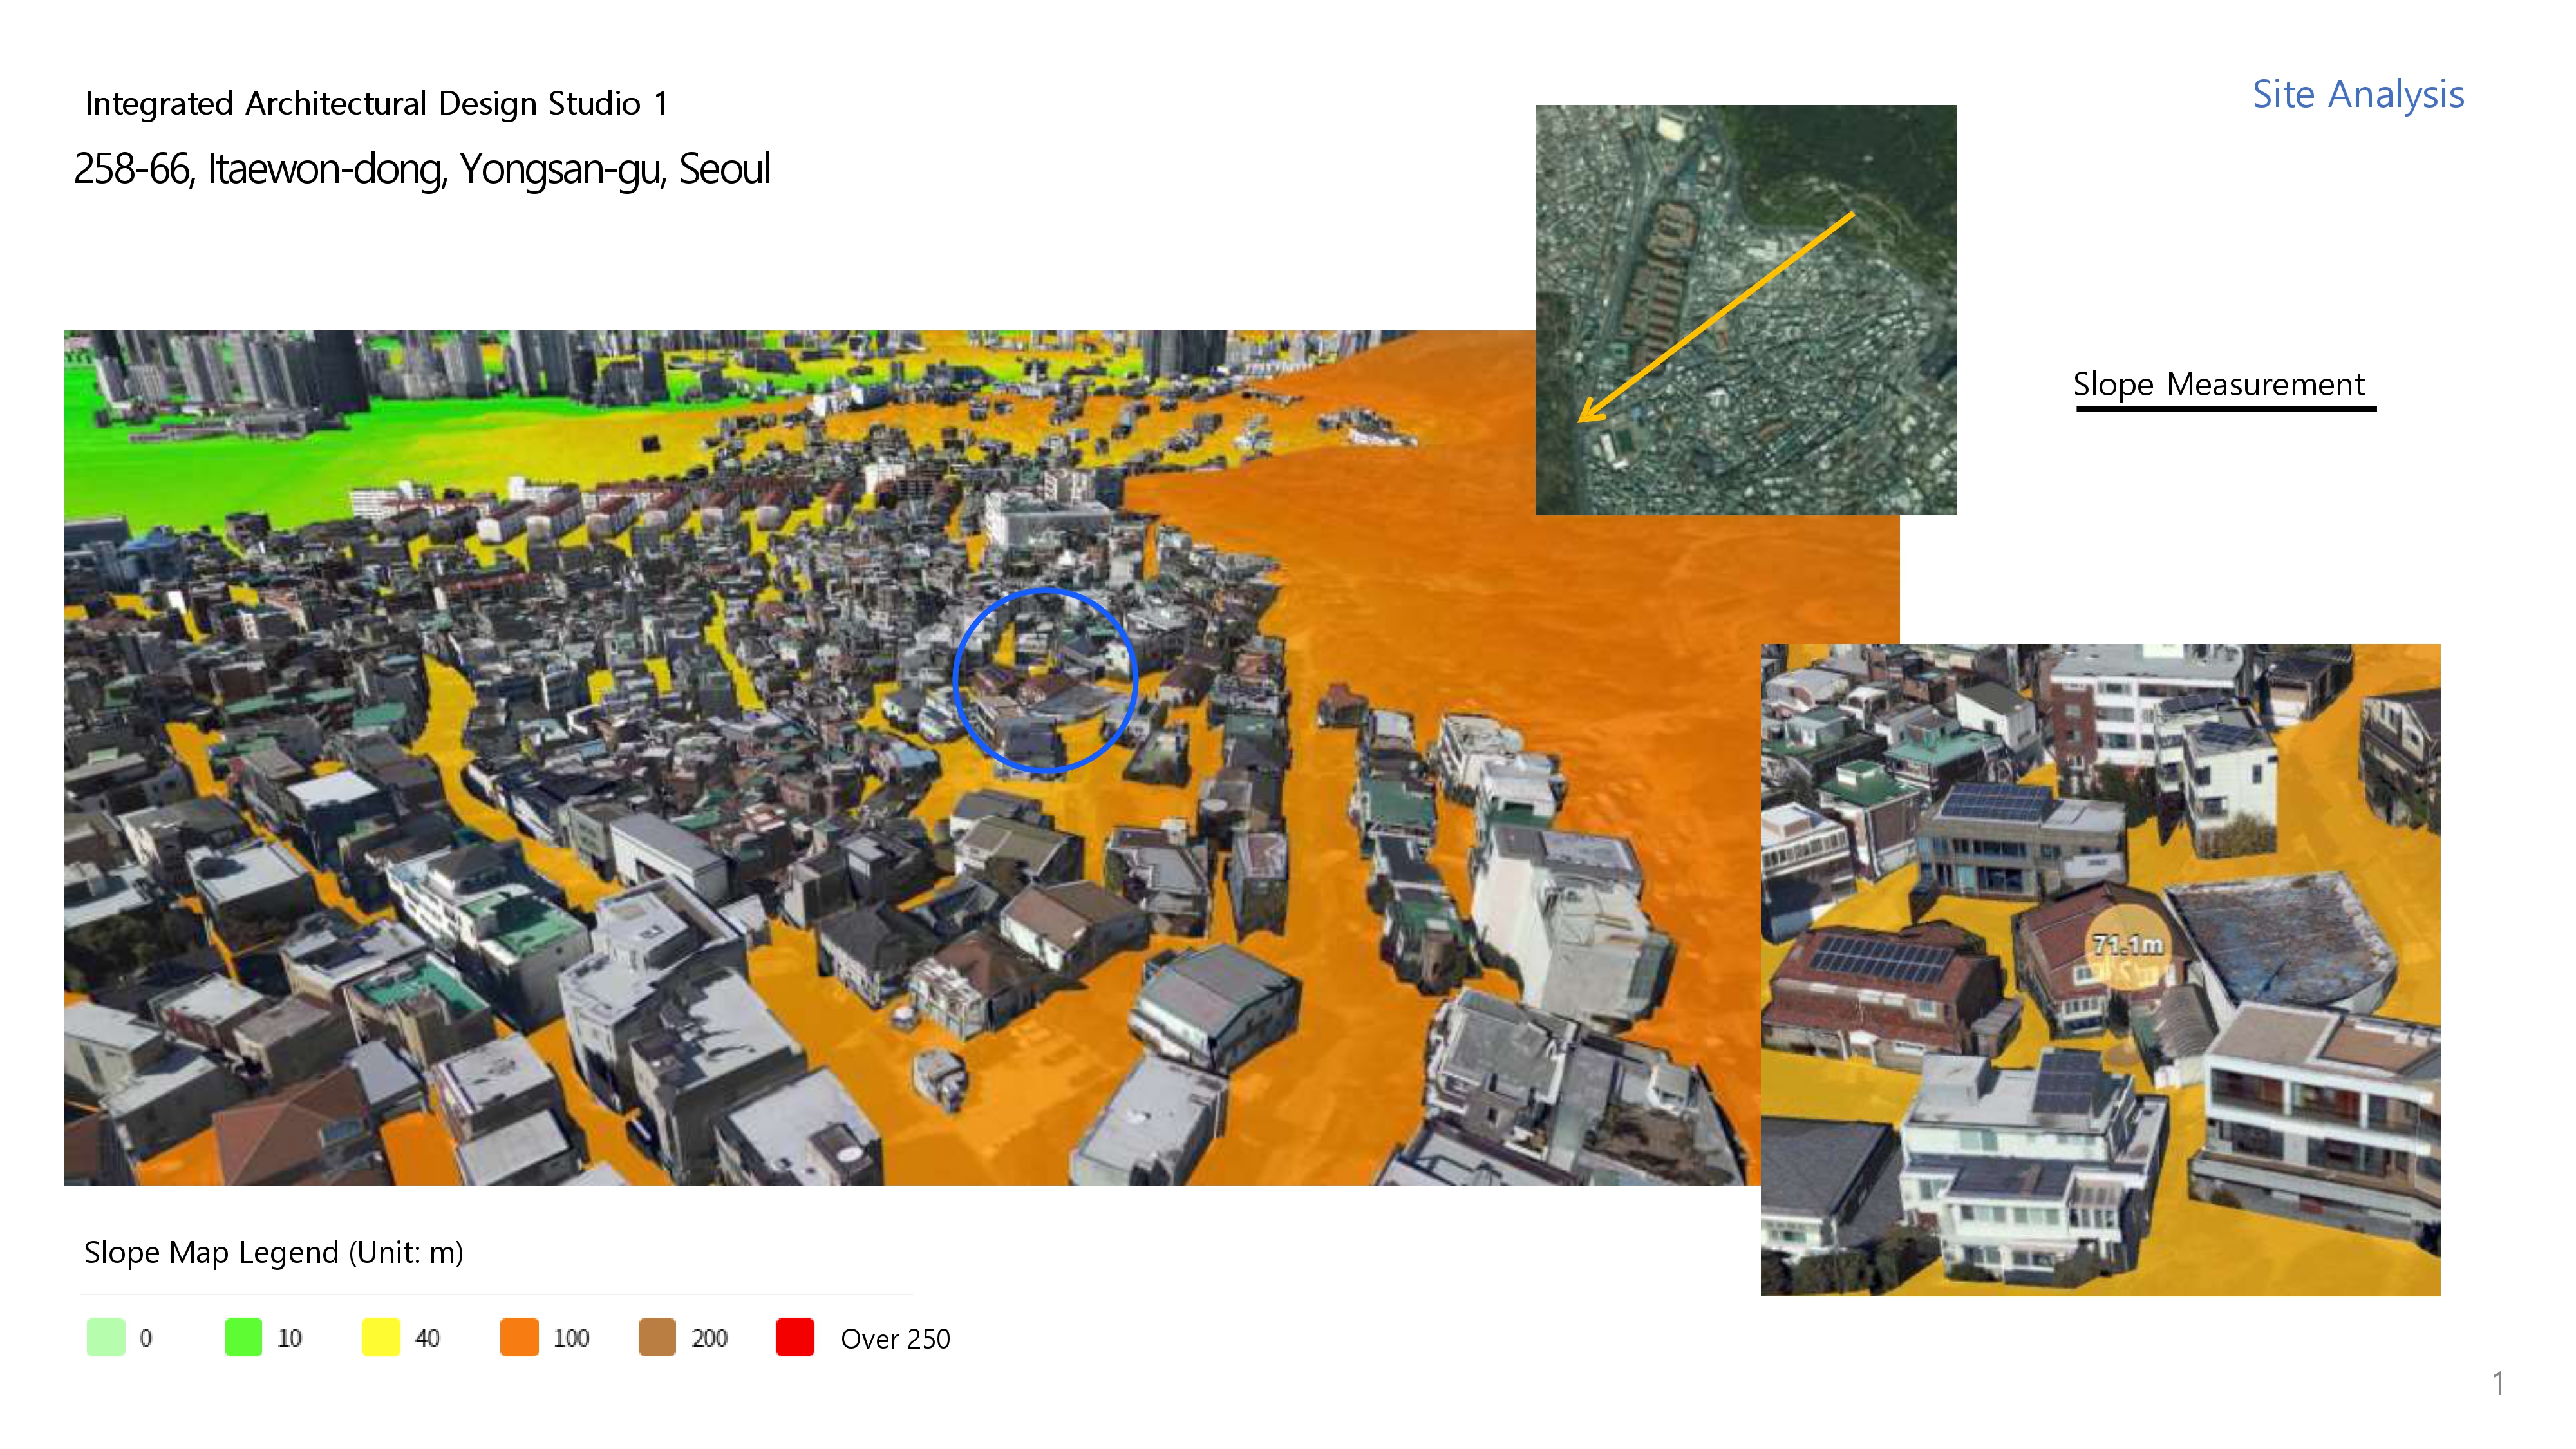
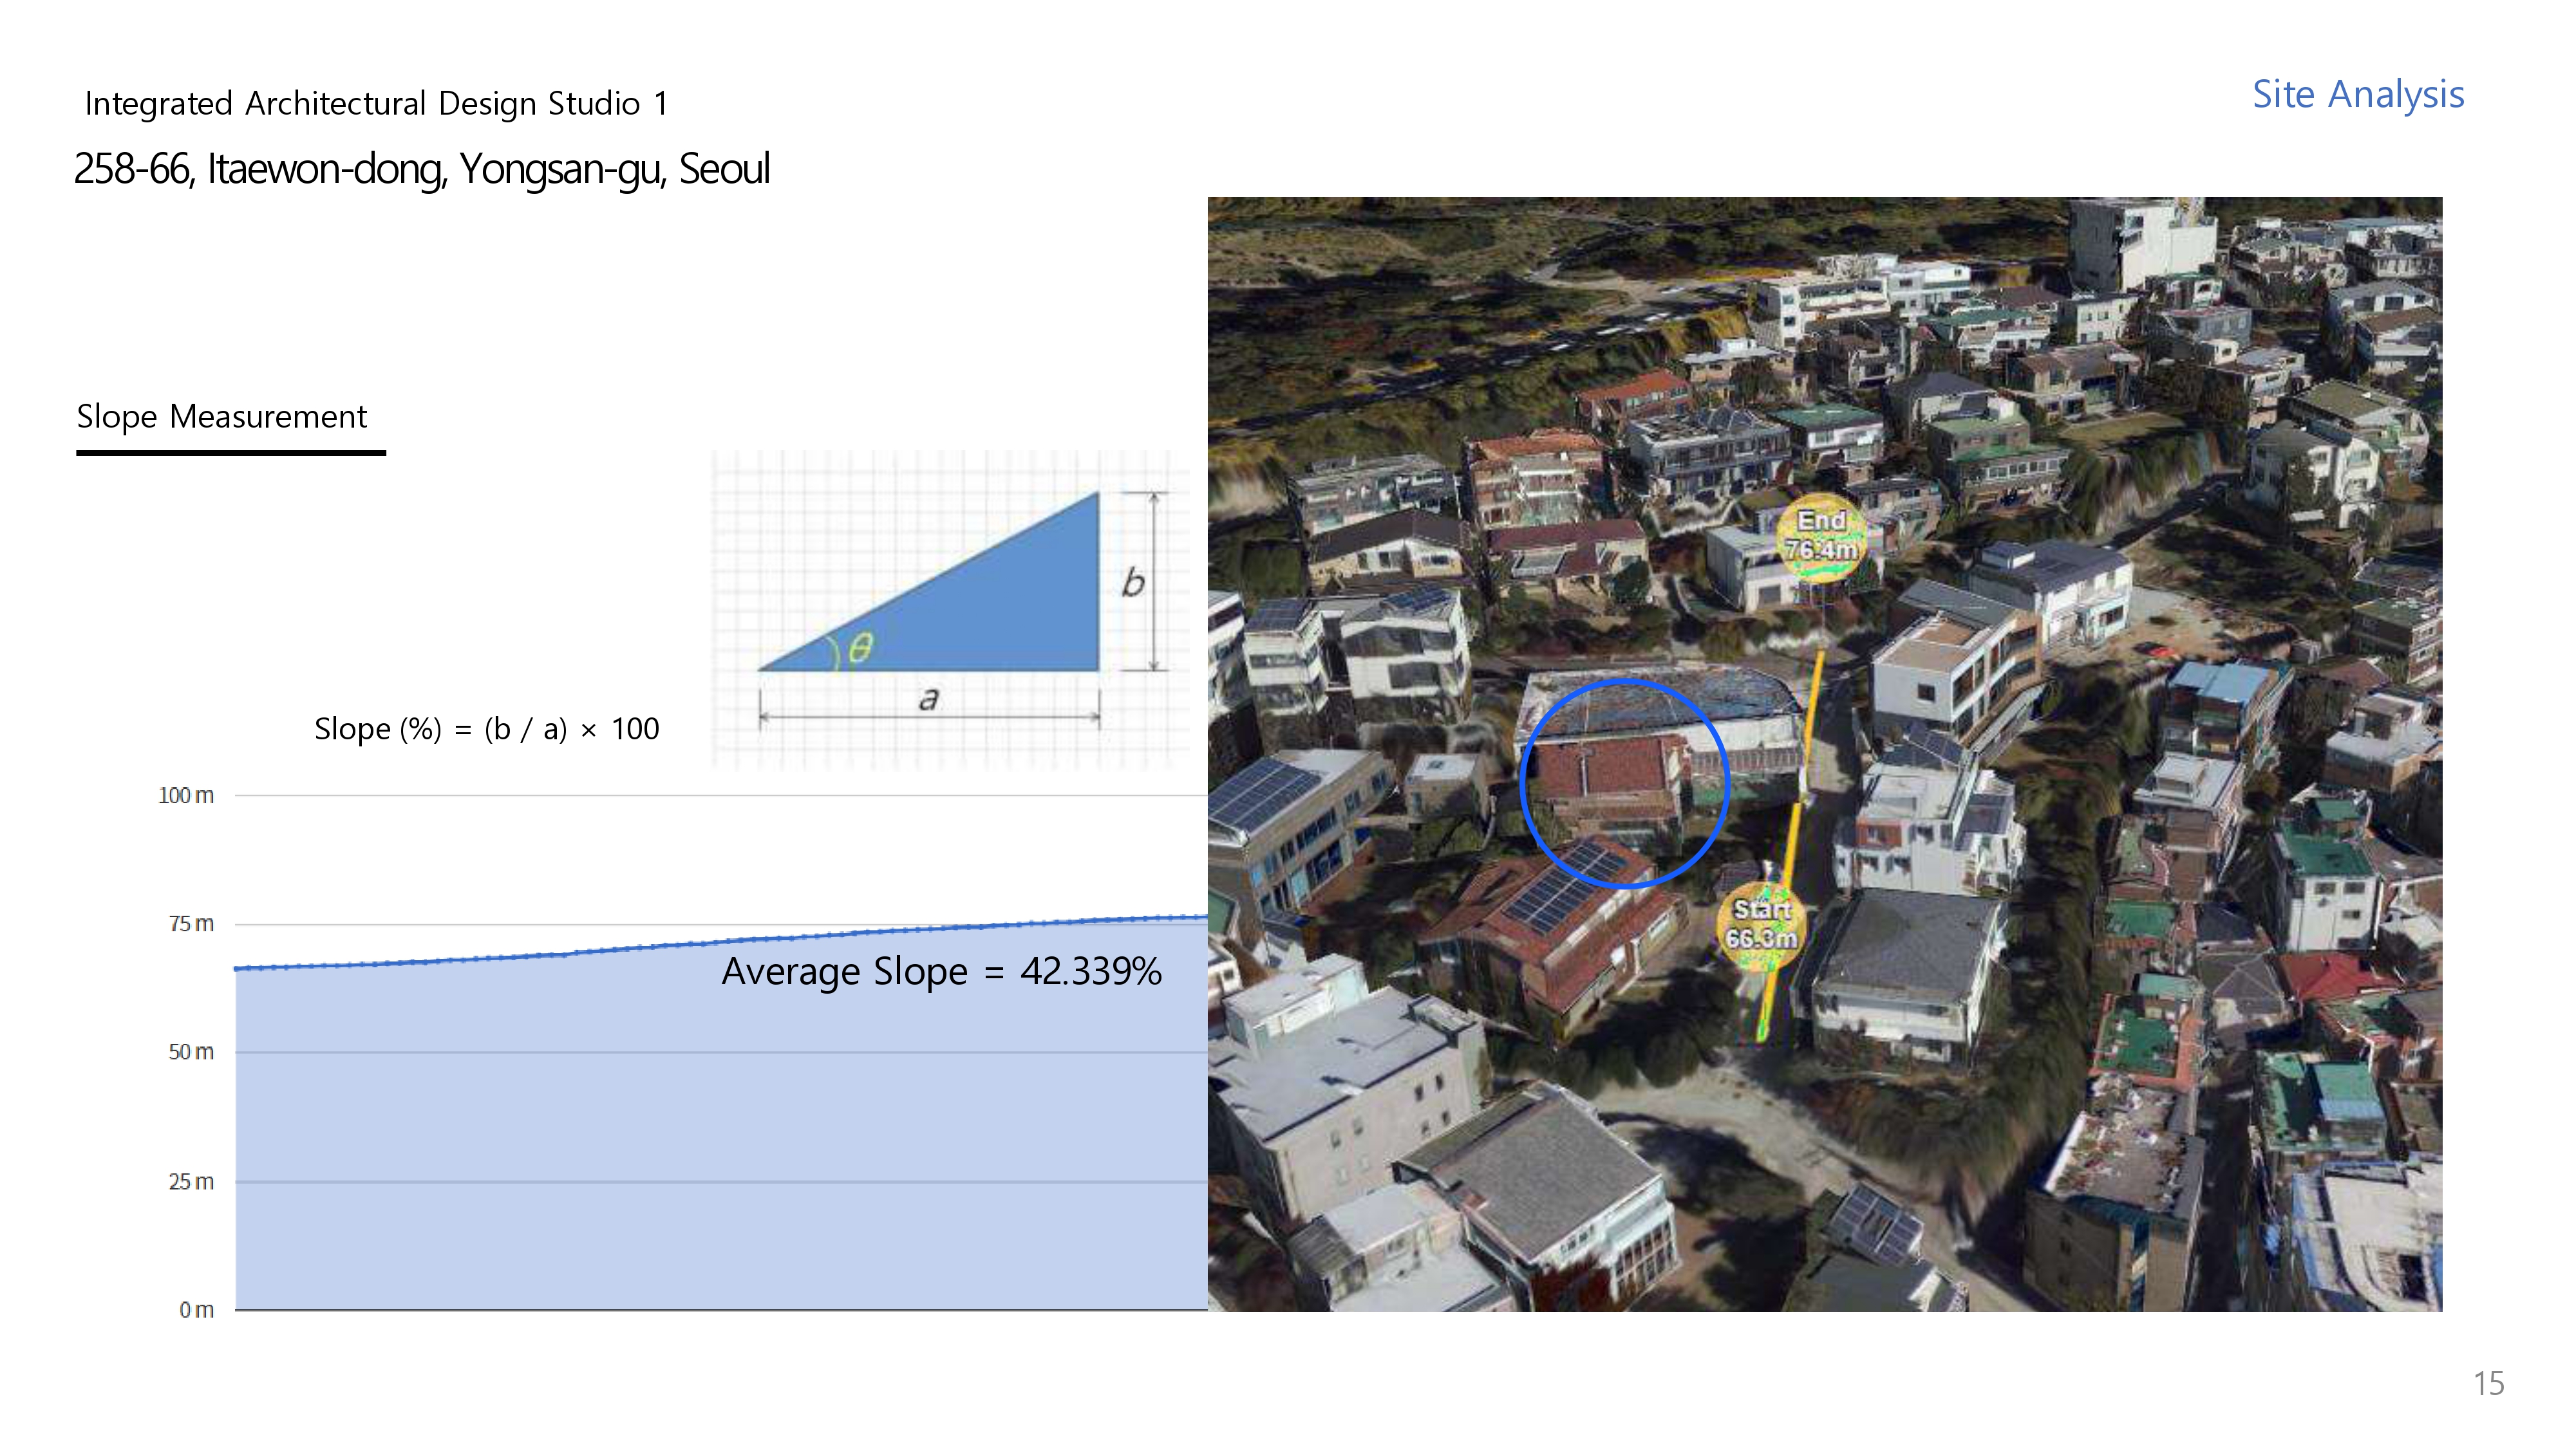
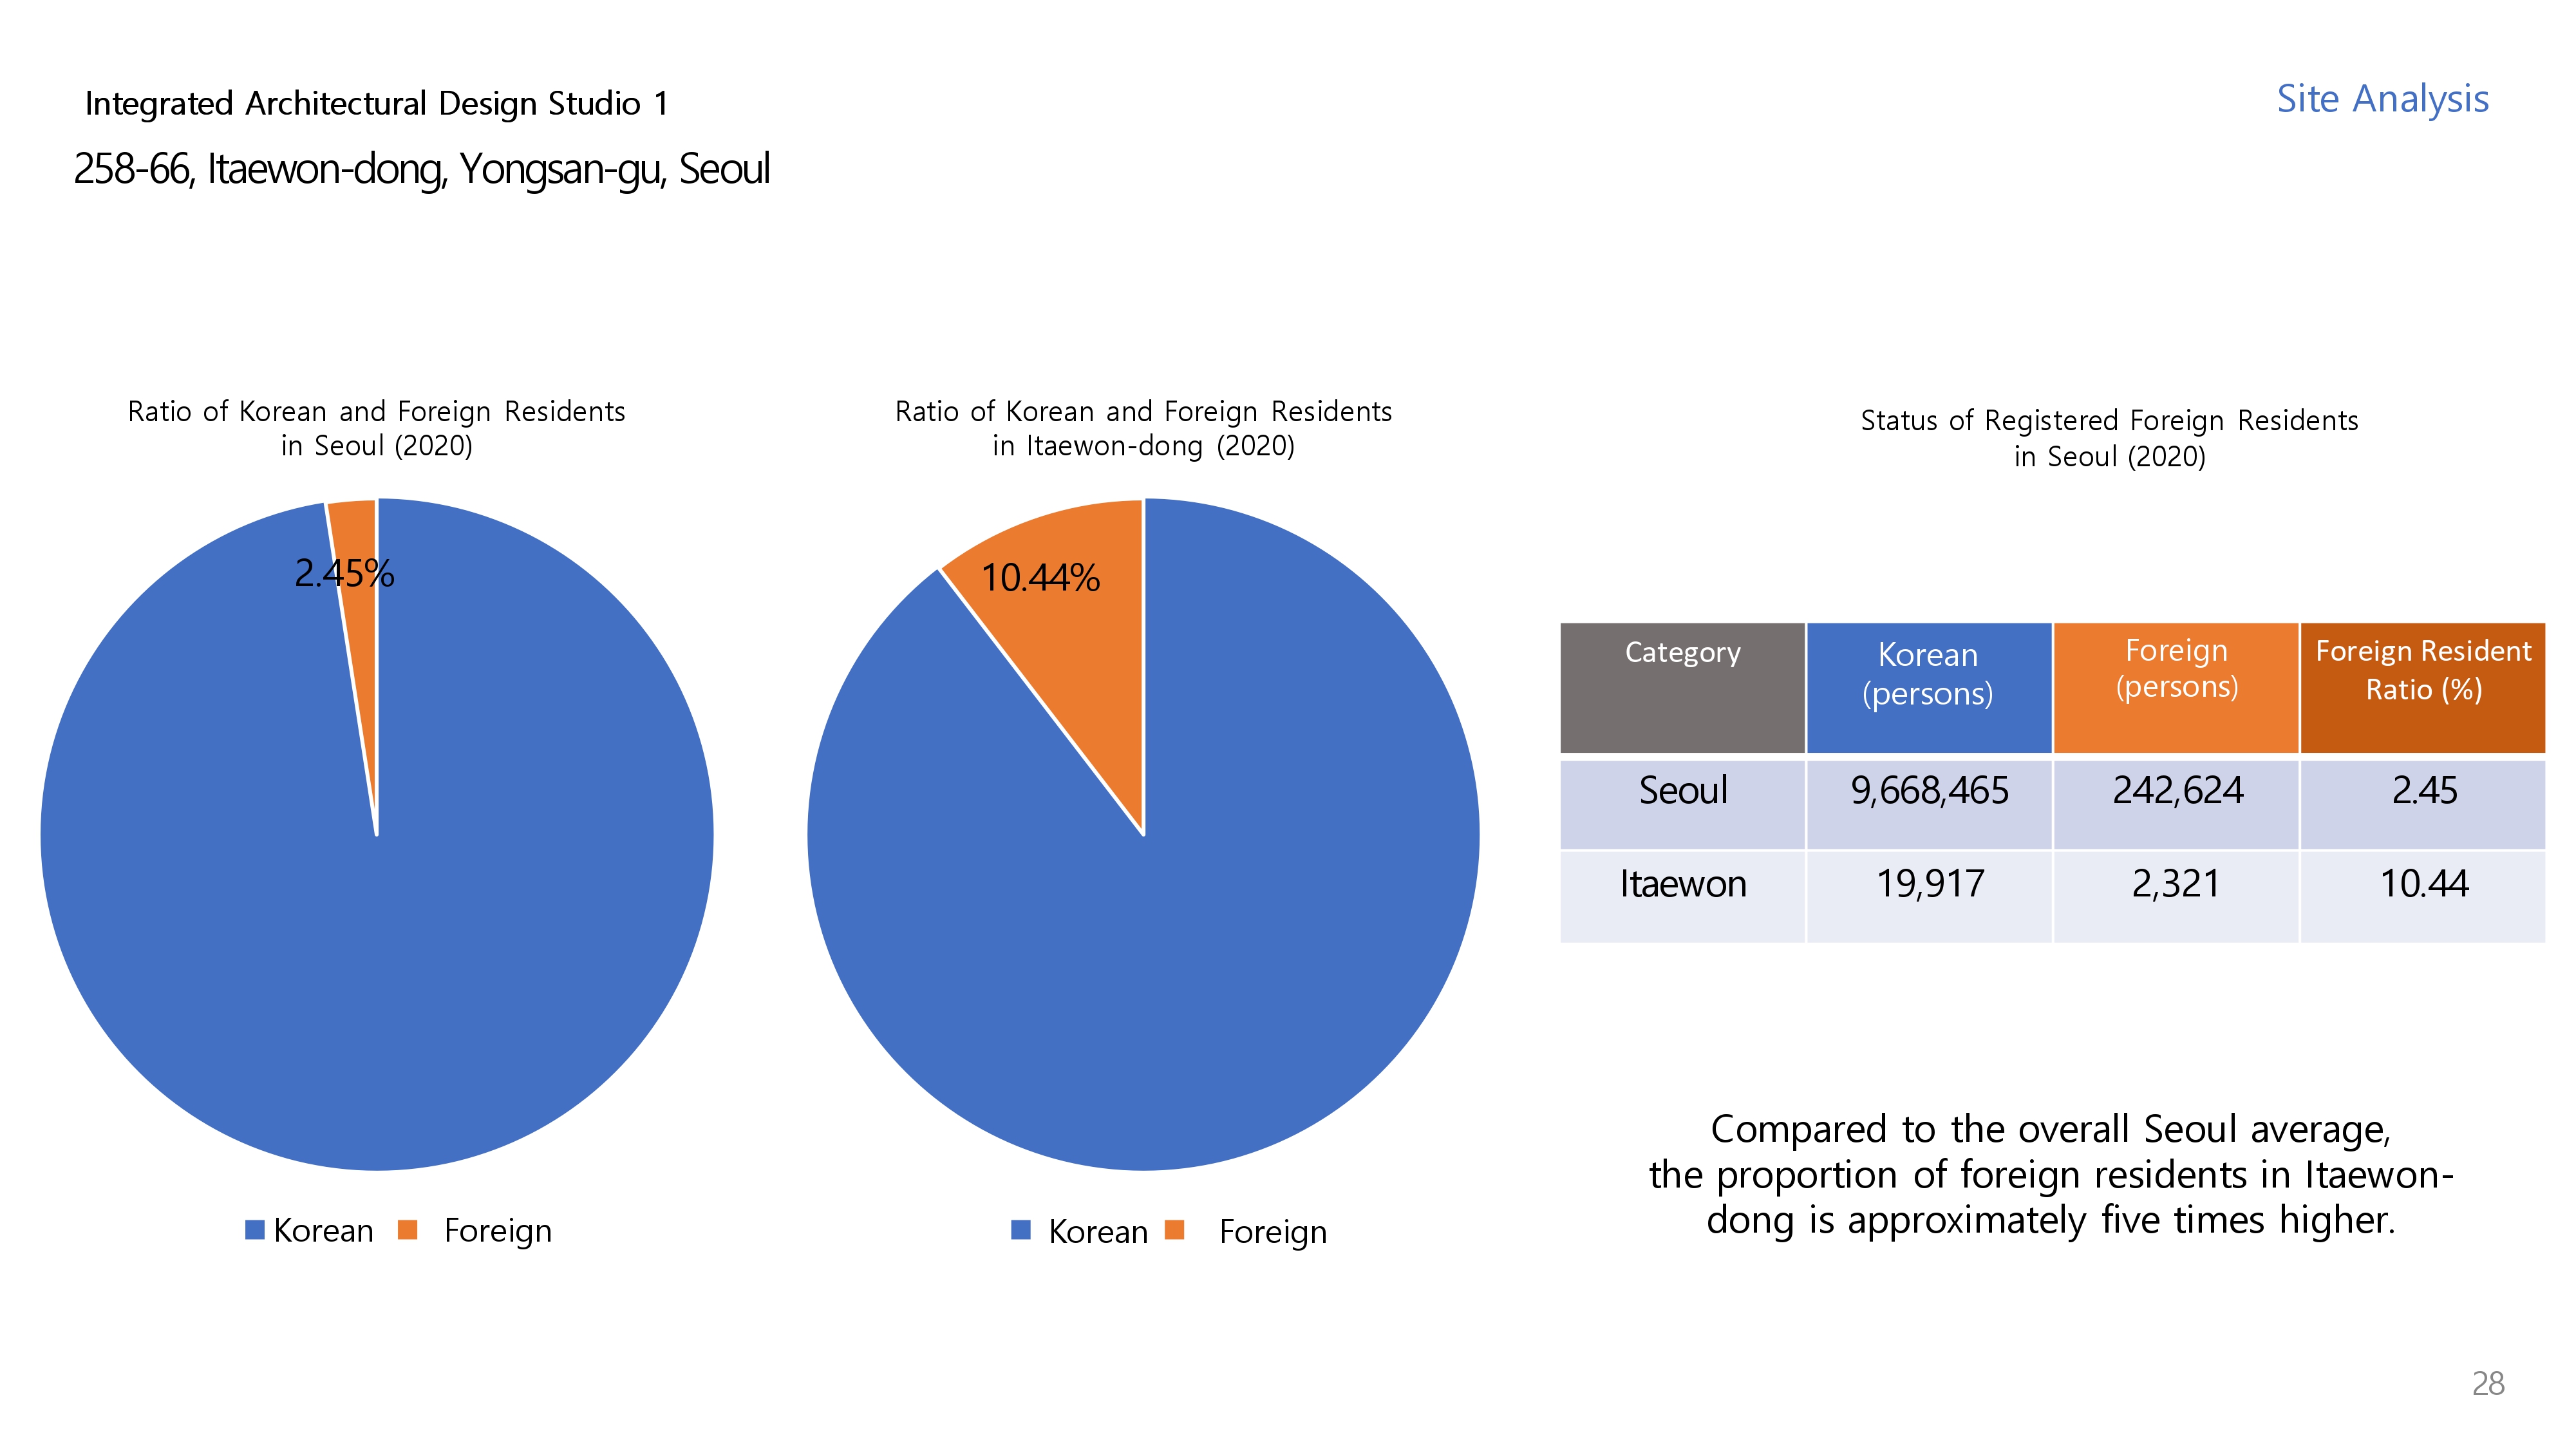
① Site Analysis
A comprehensive study of the project’s physical, environmental, and regulatory context, structured as follows:
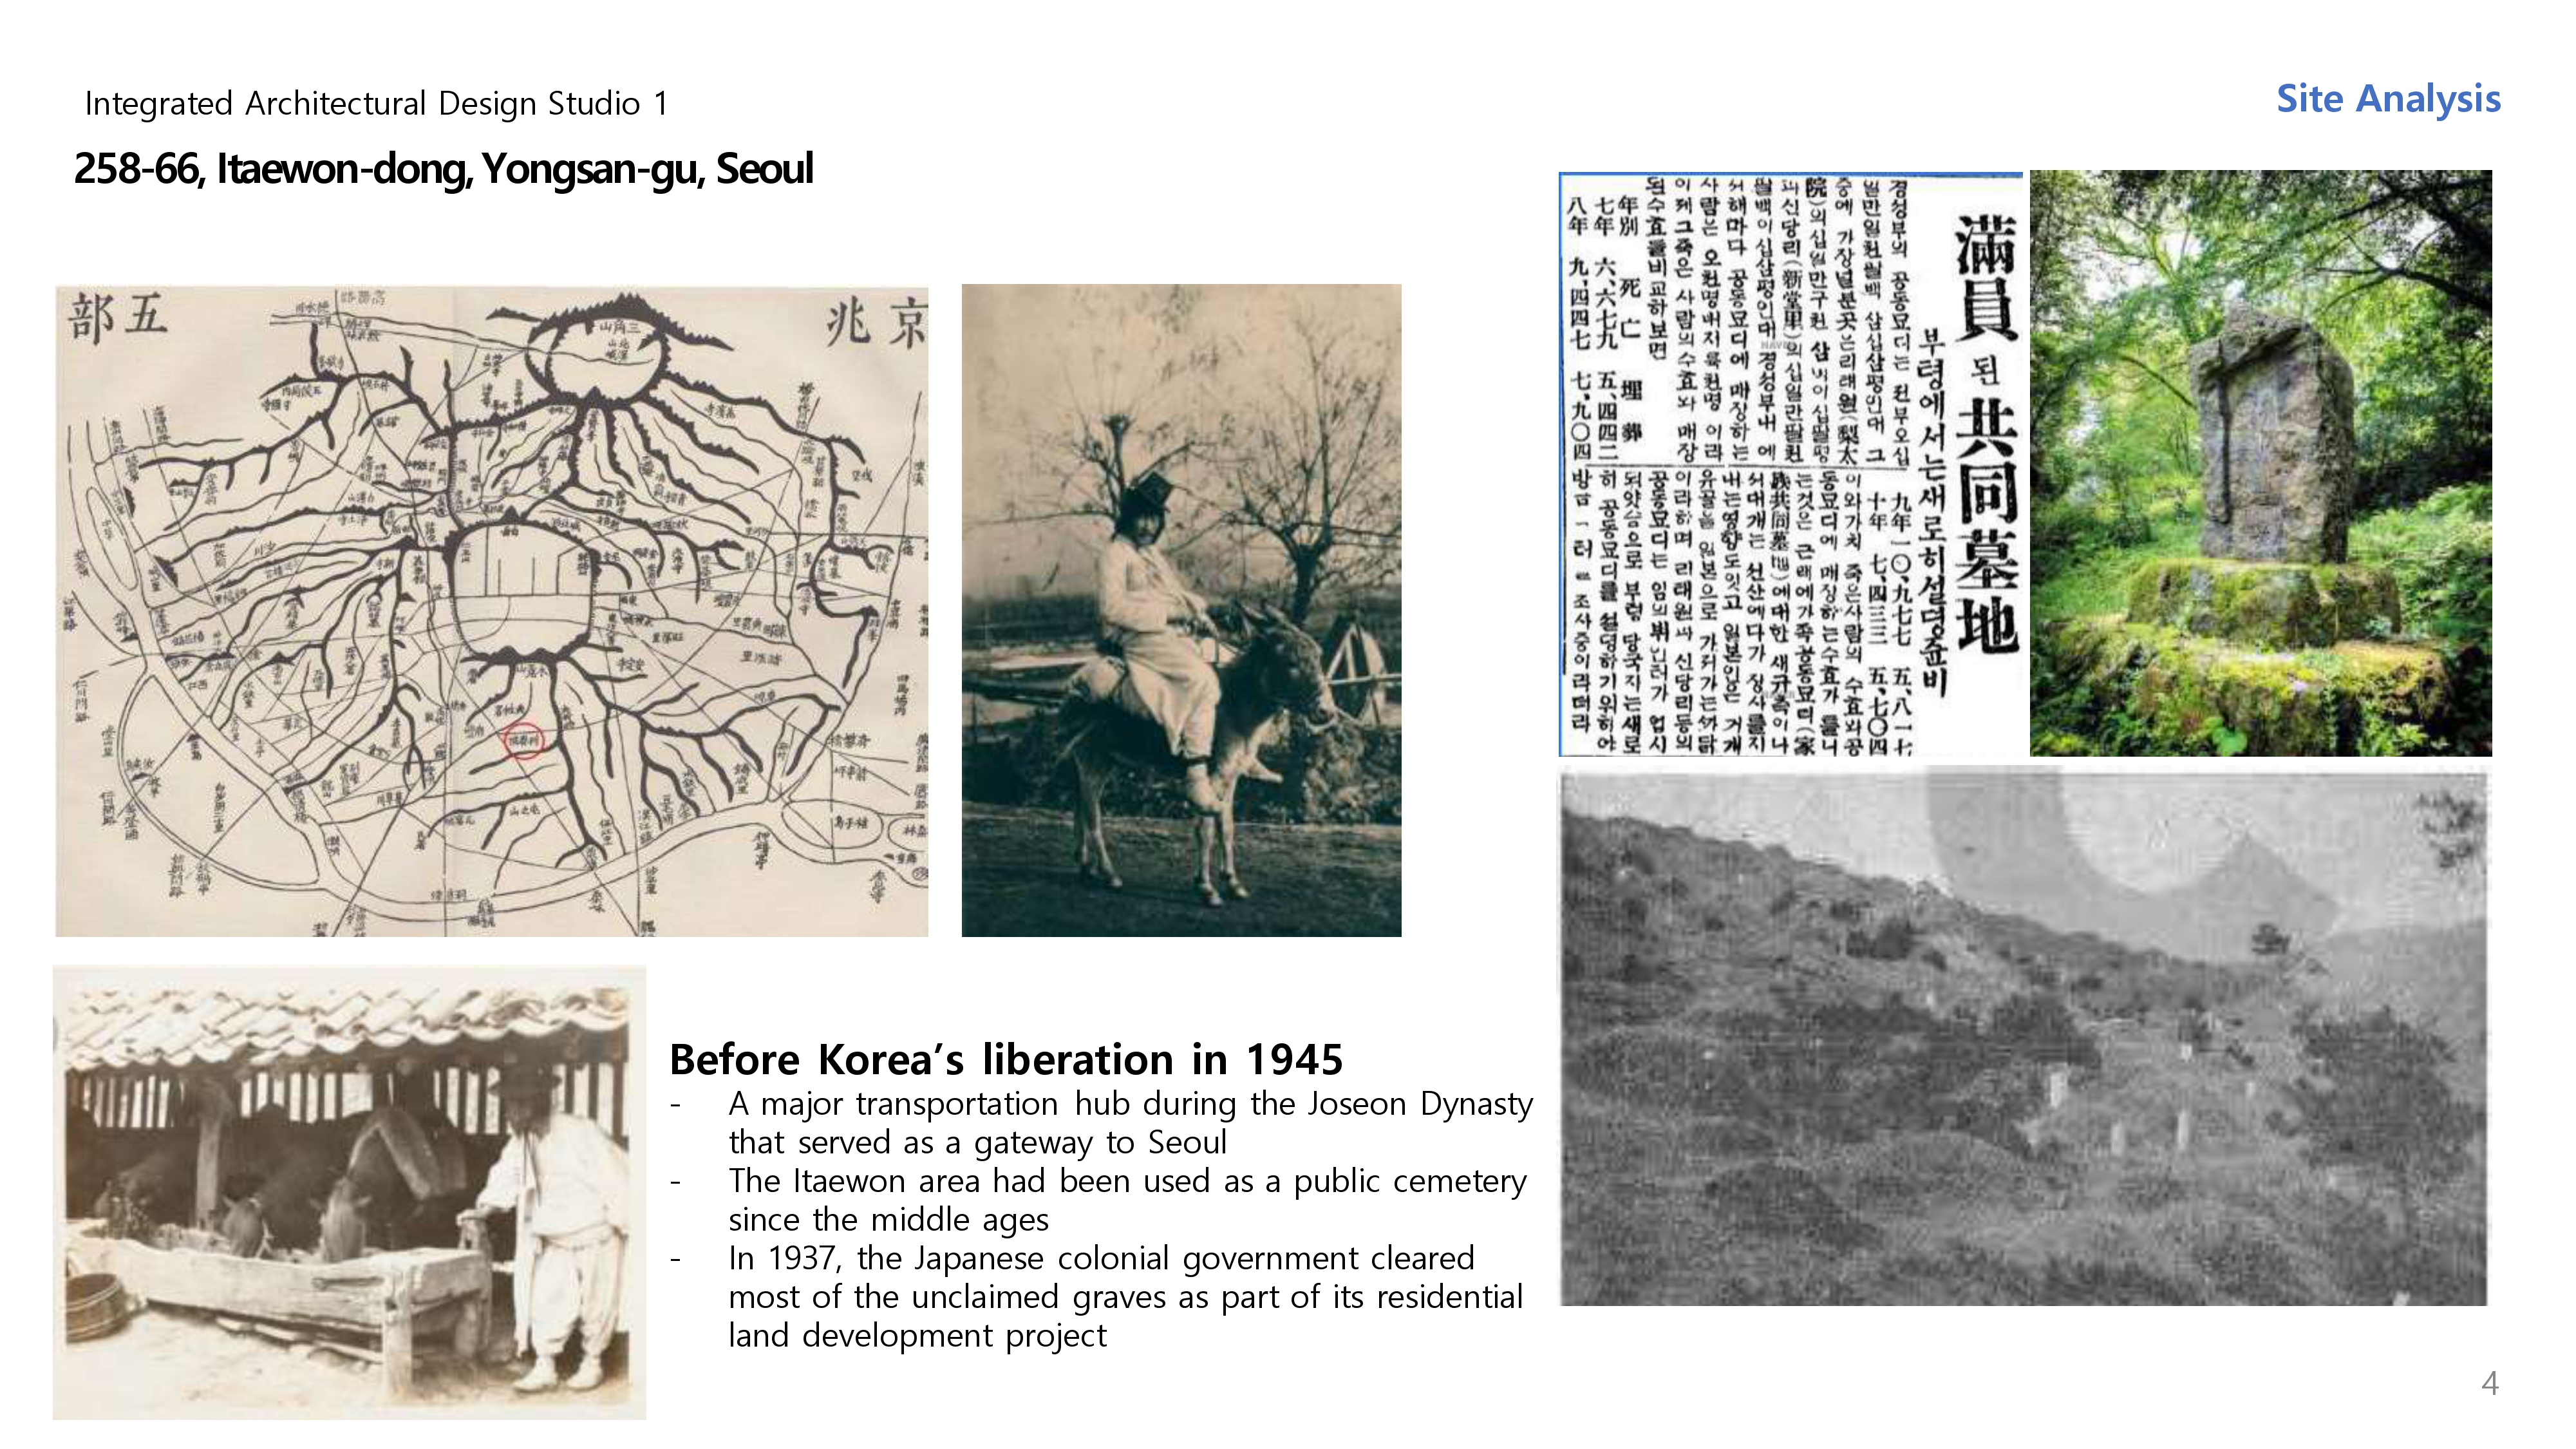
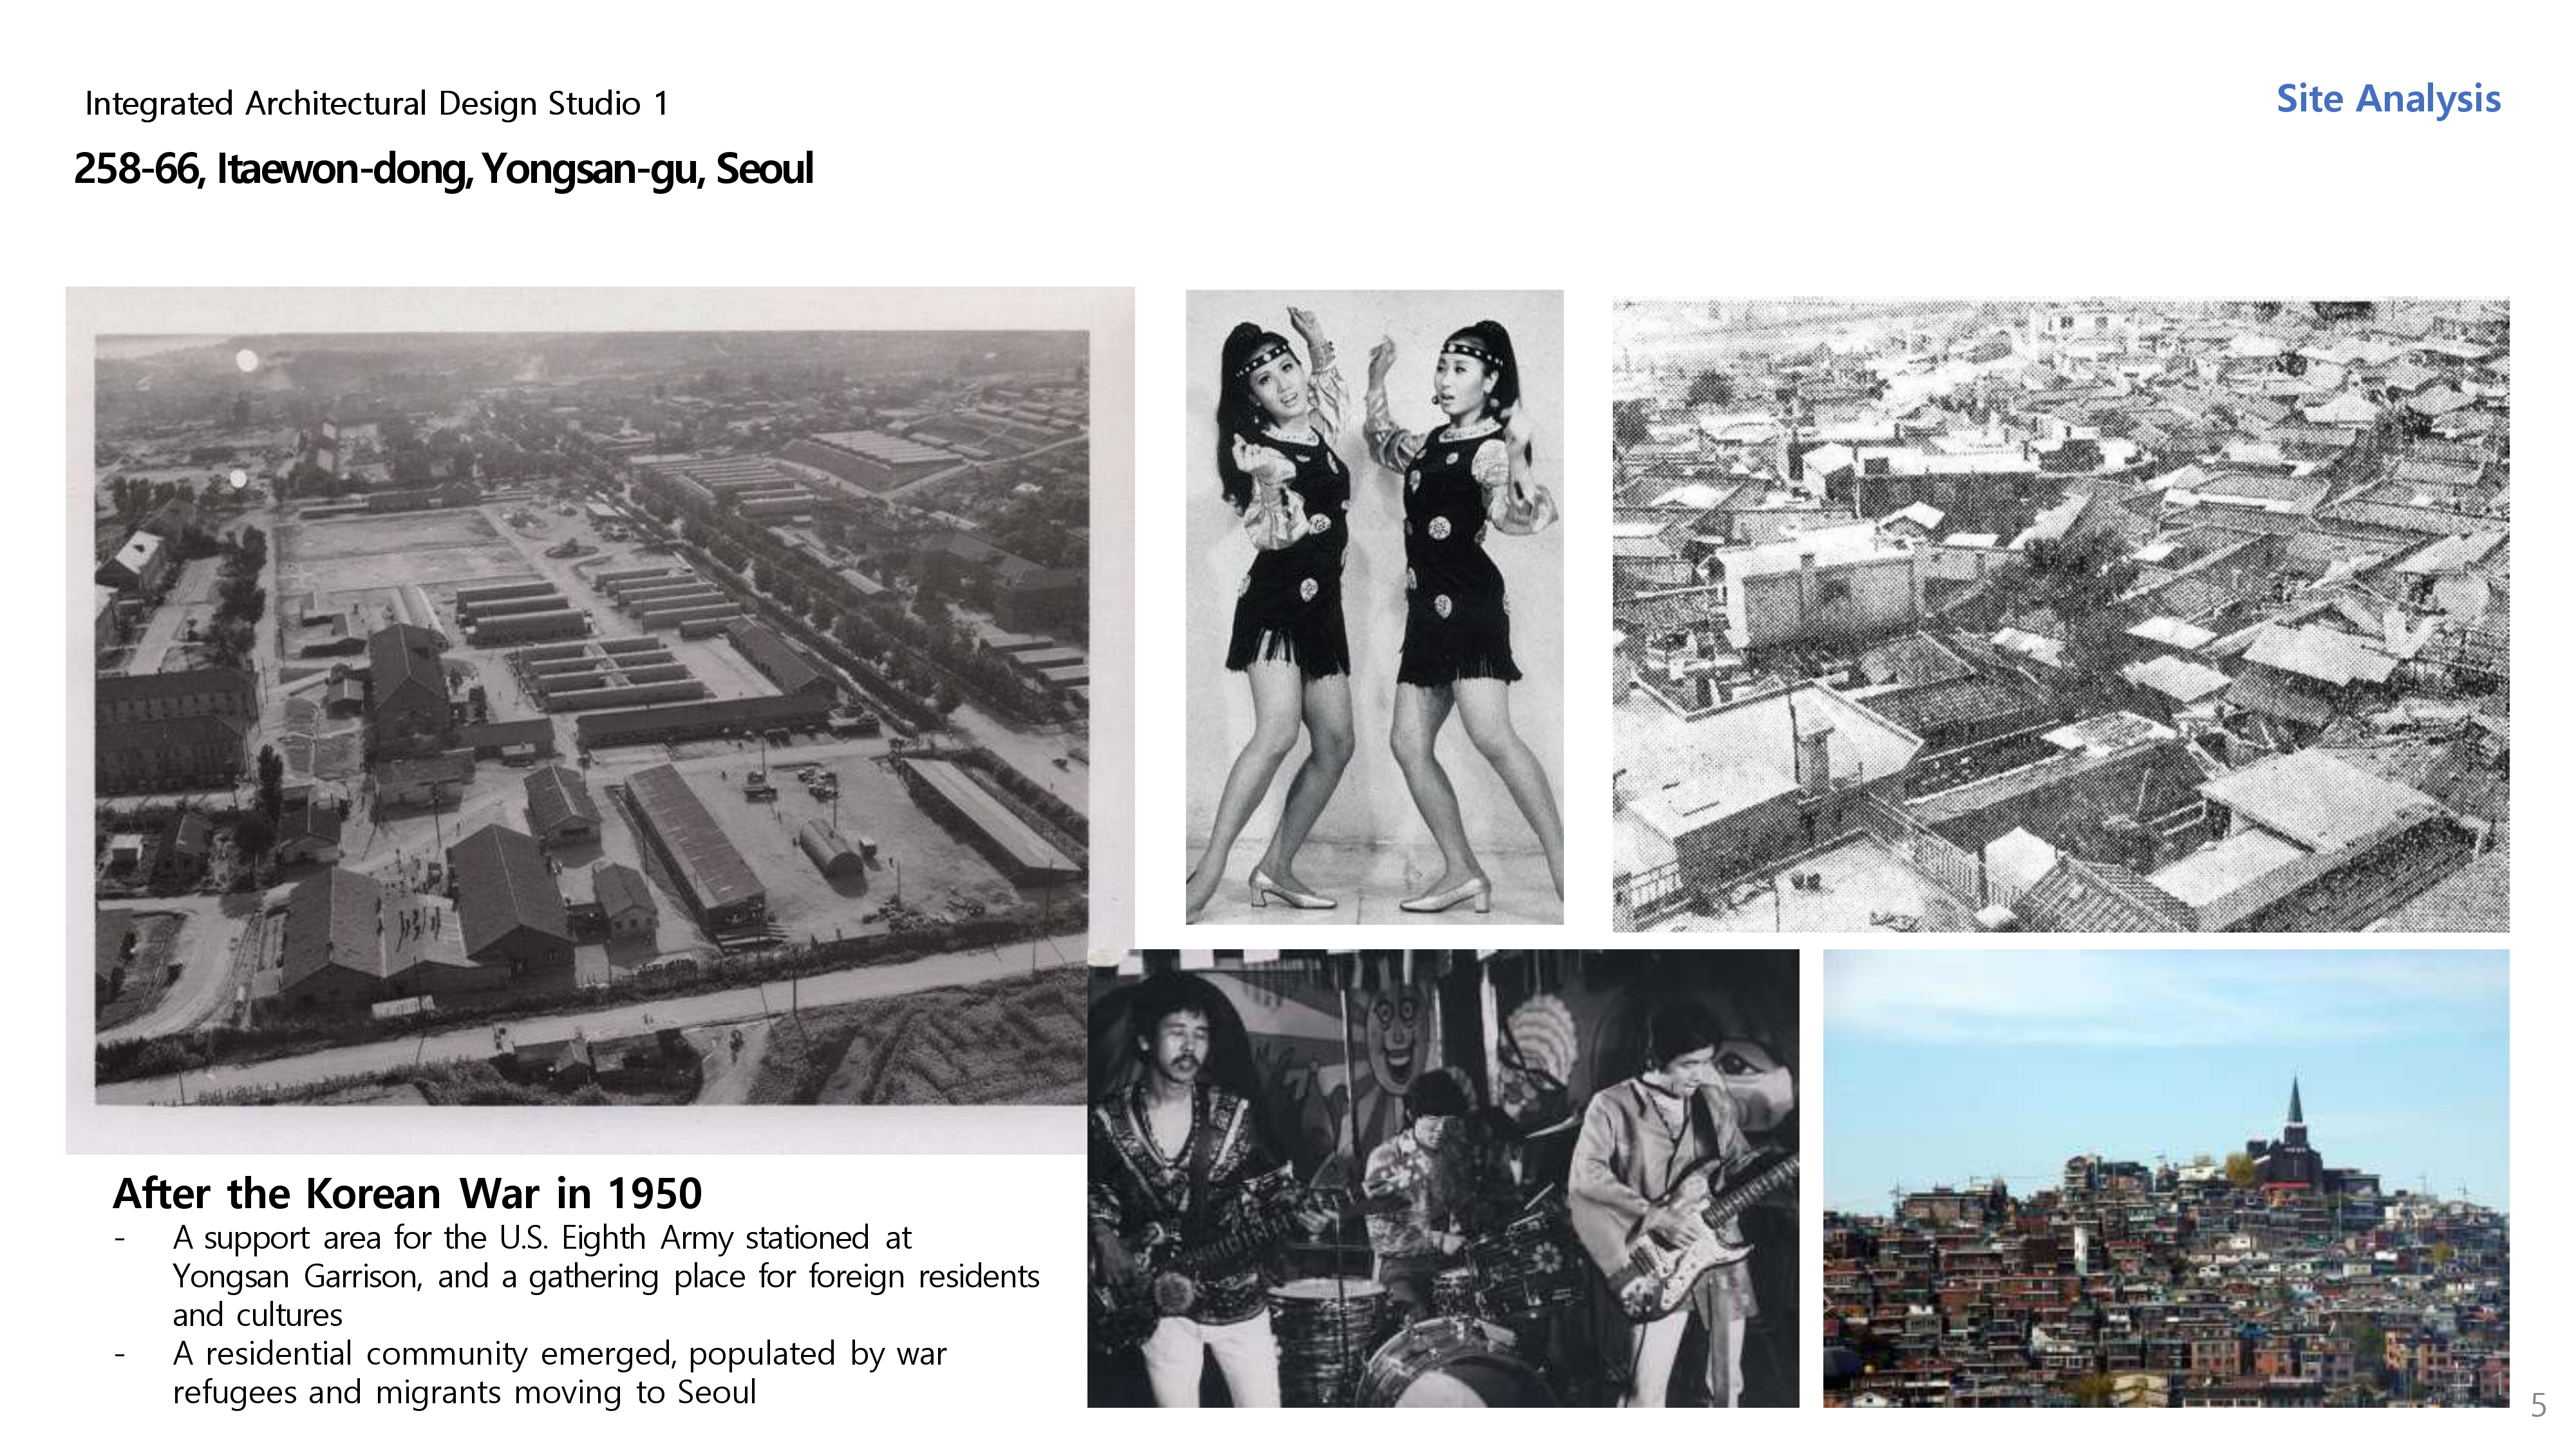
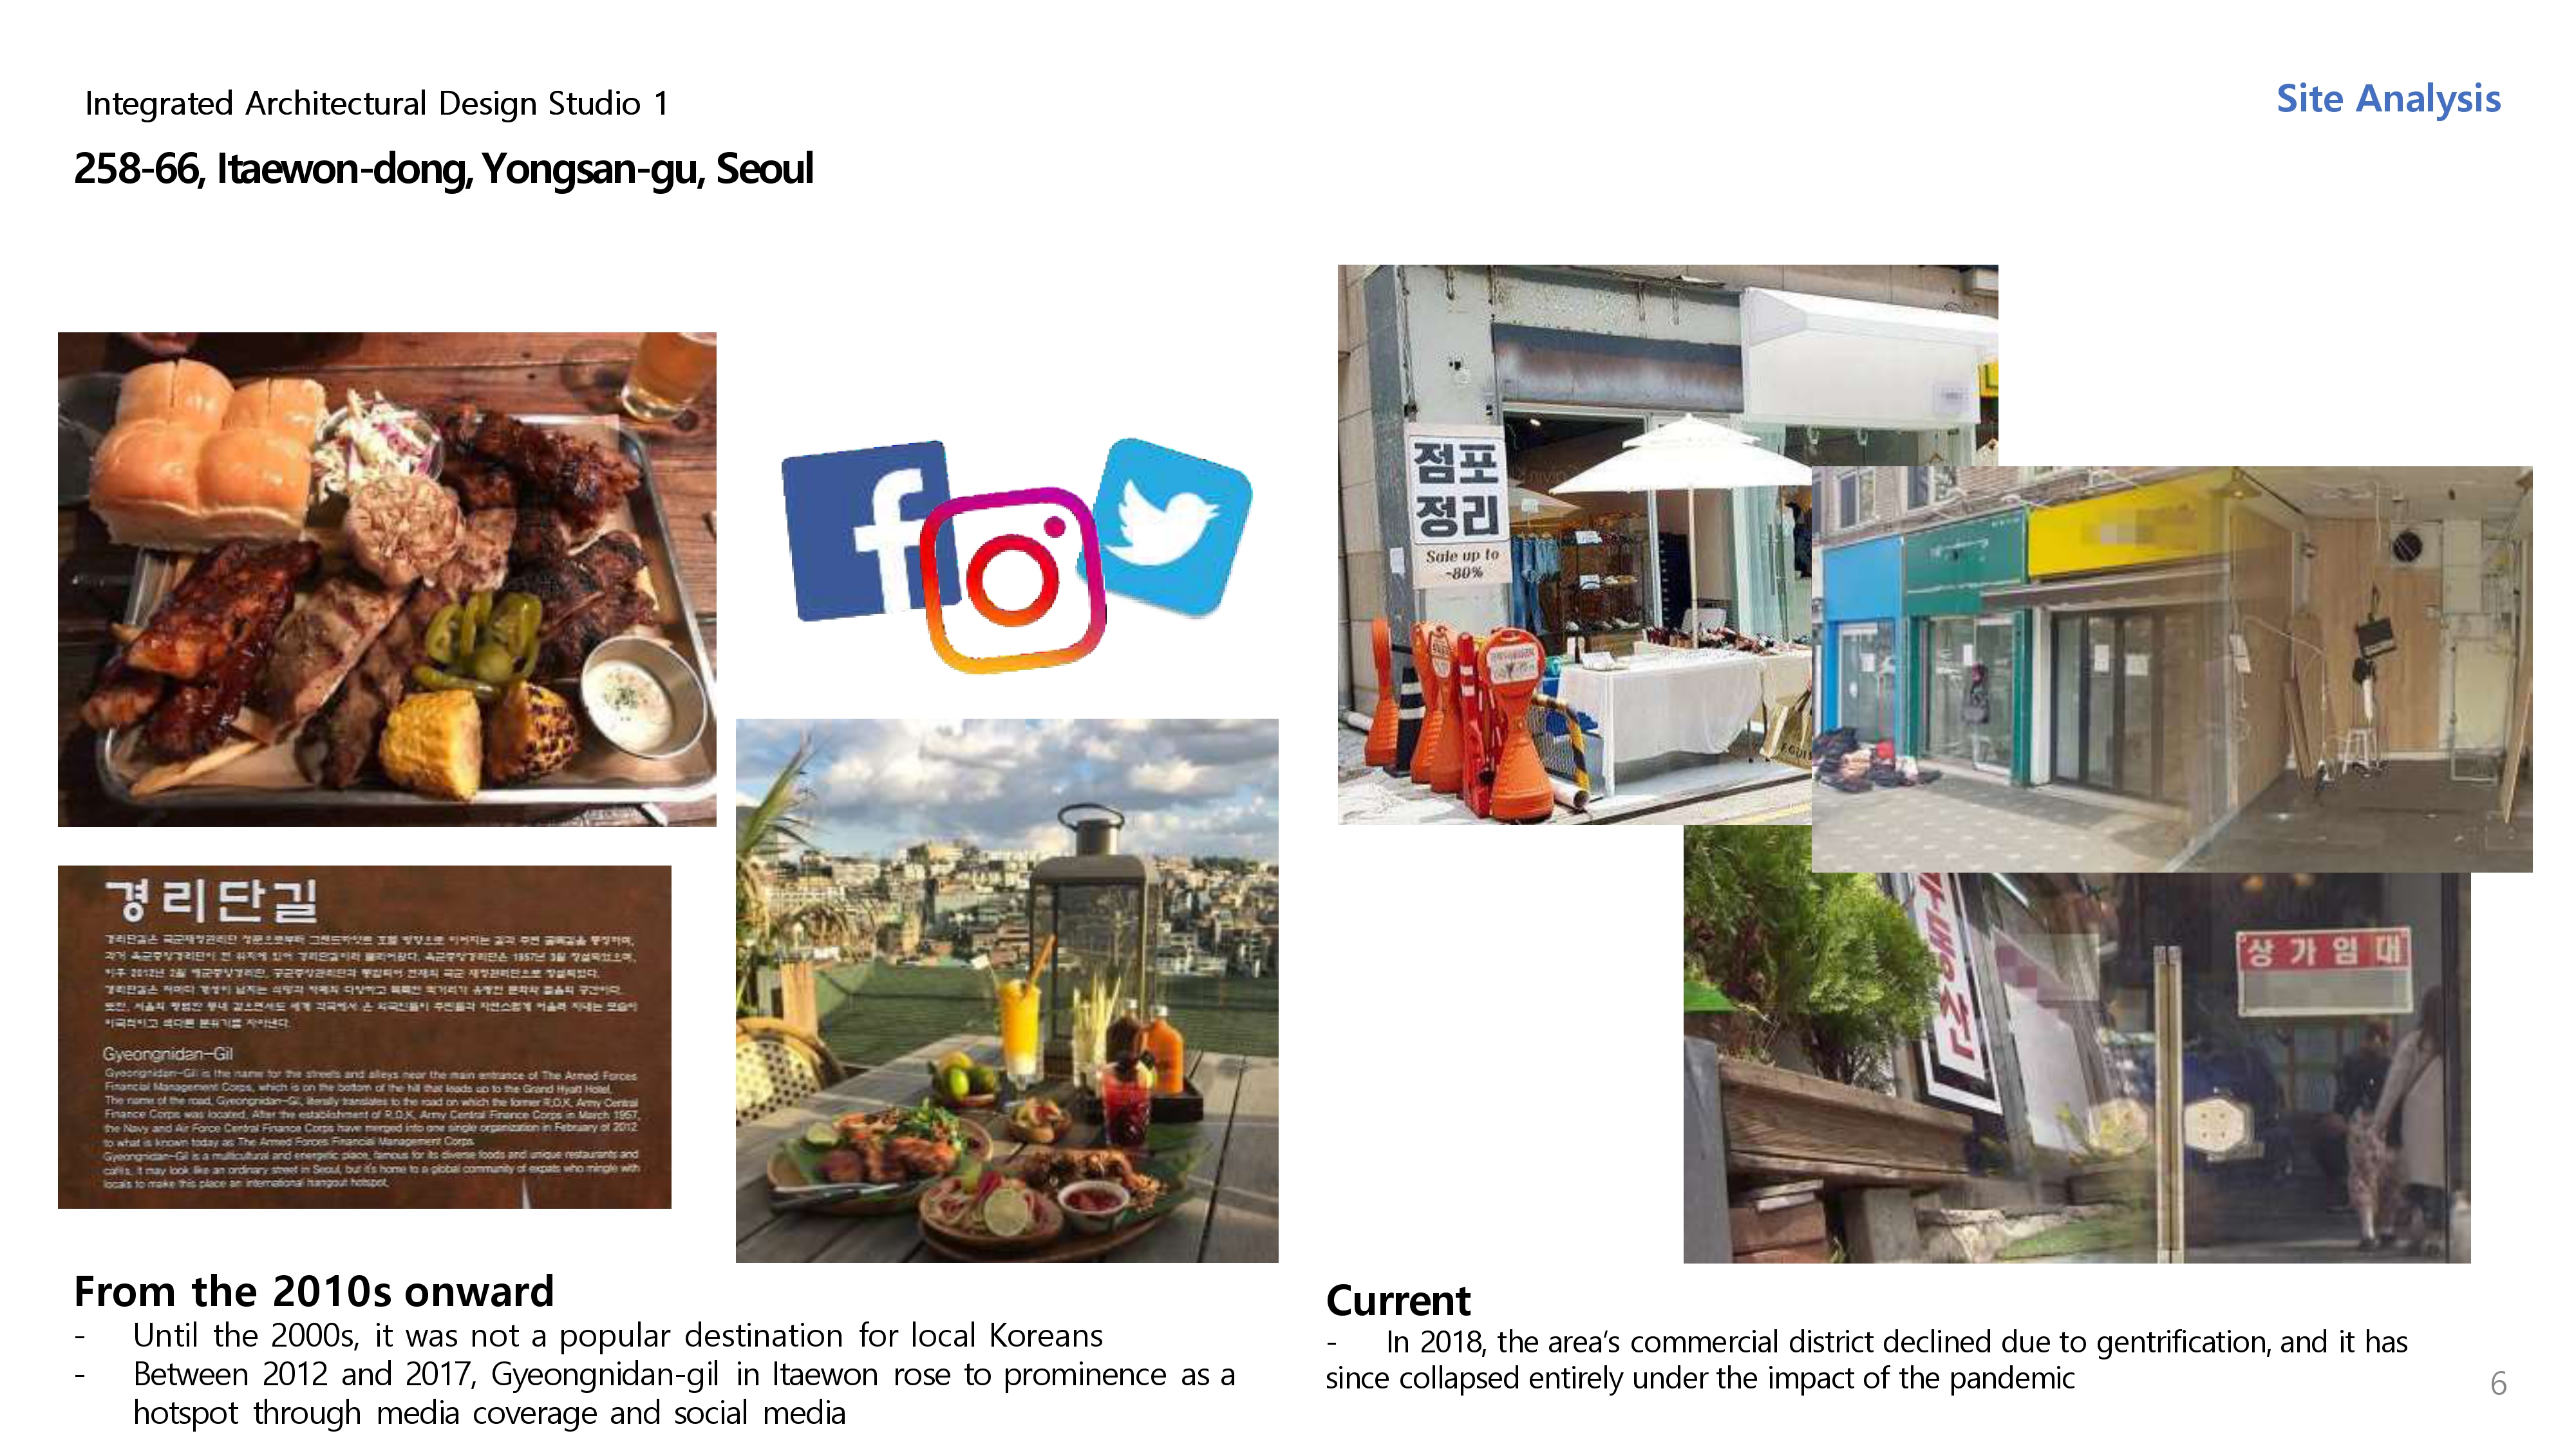
- History
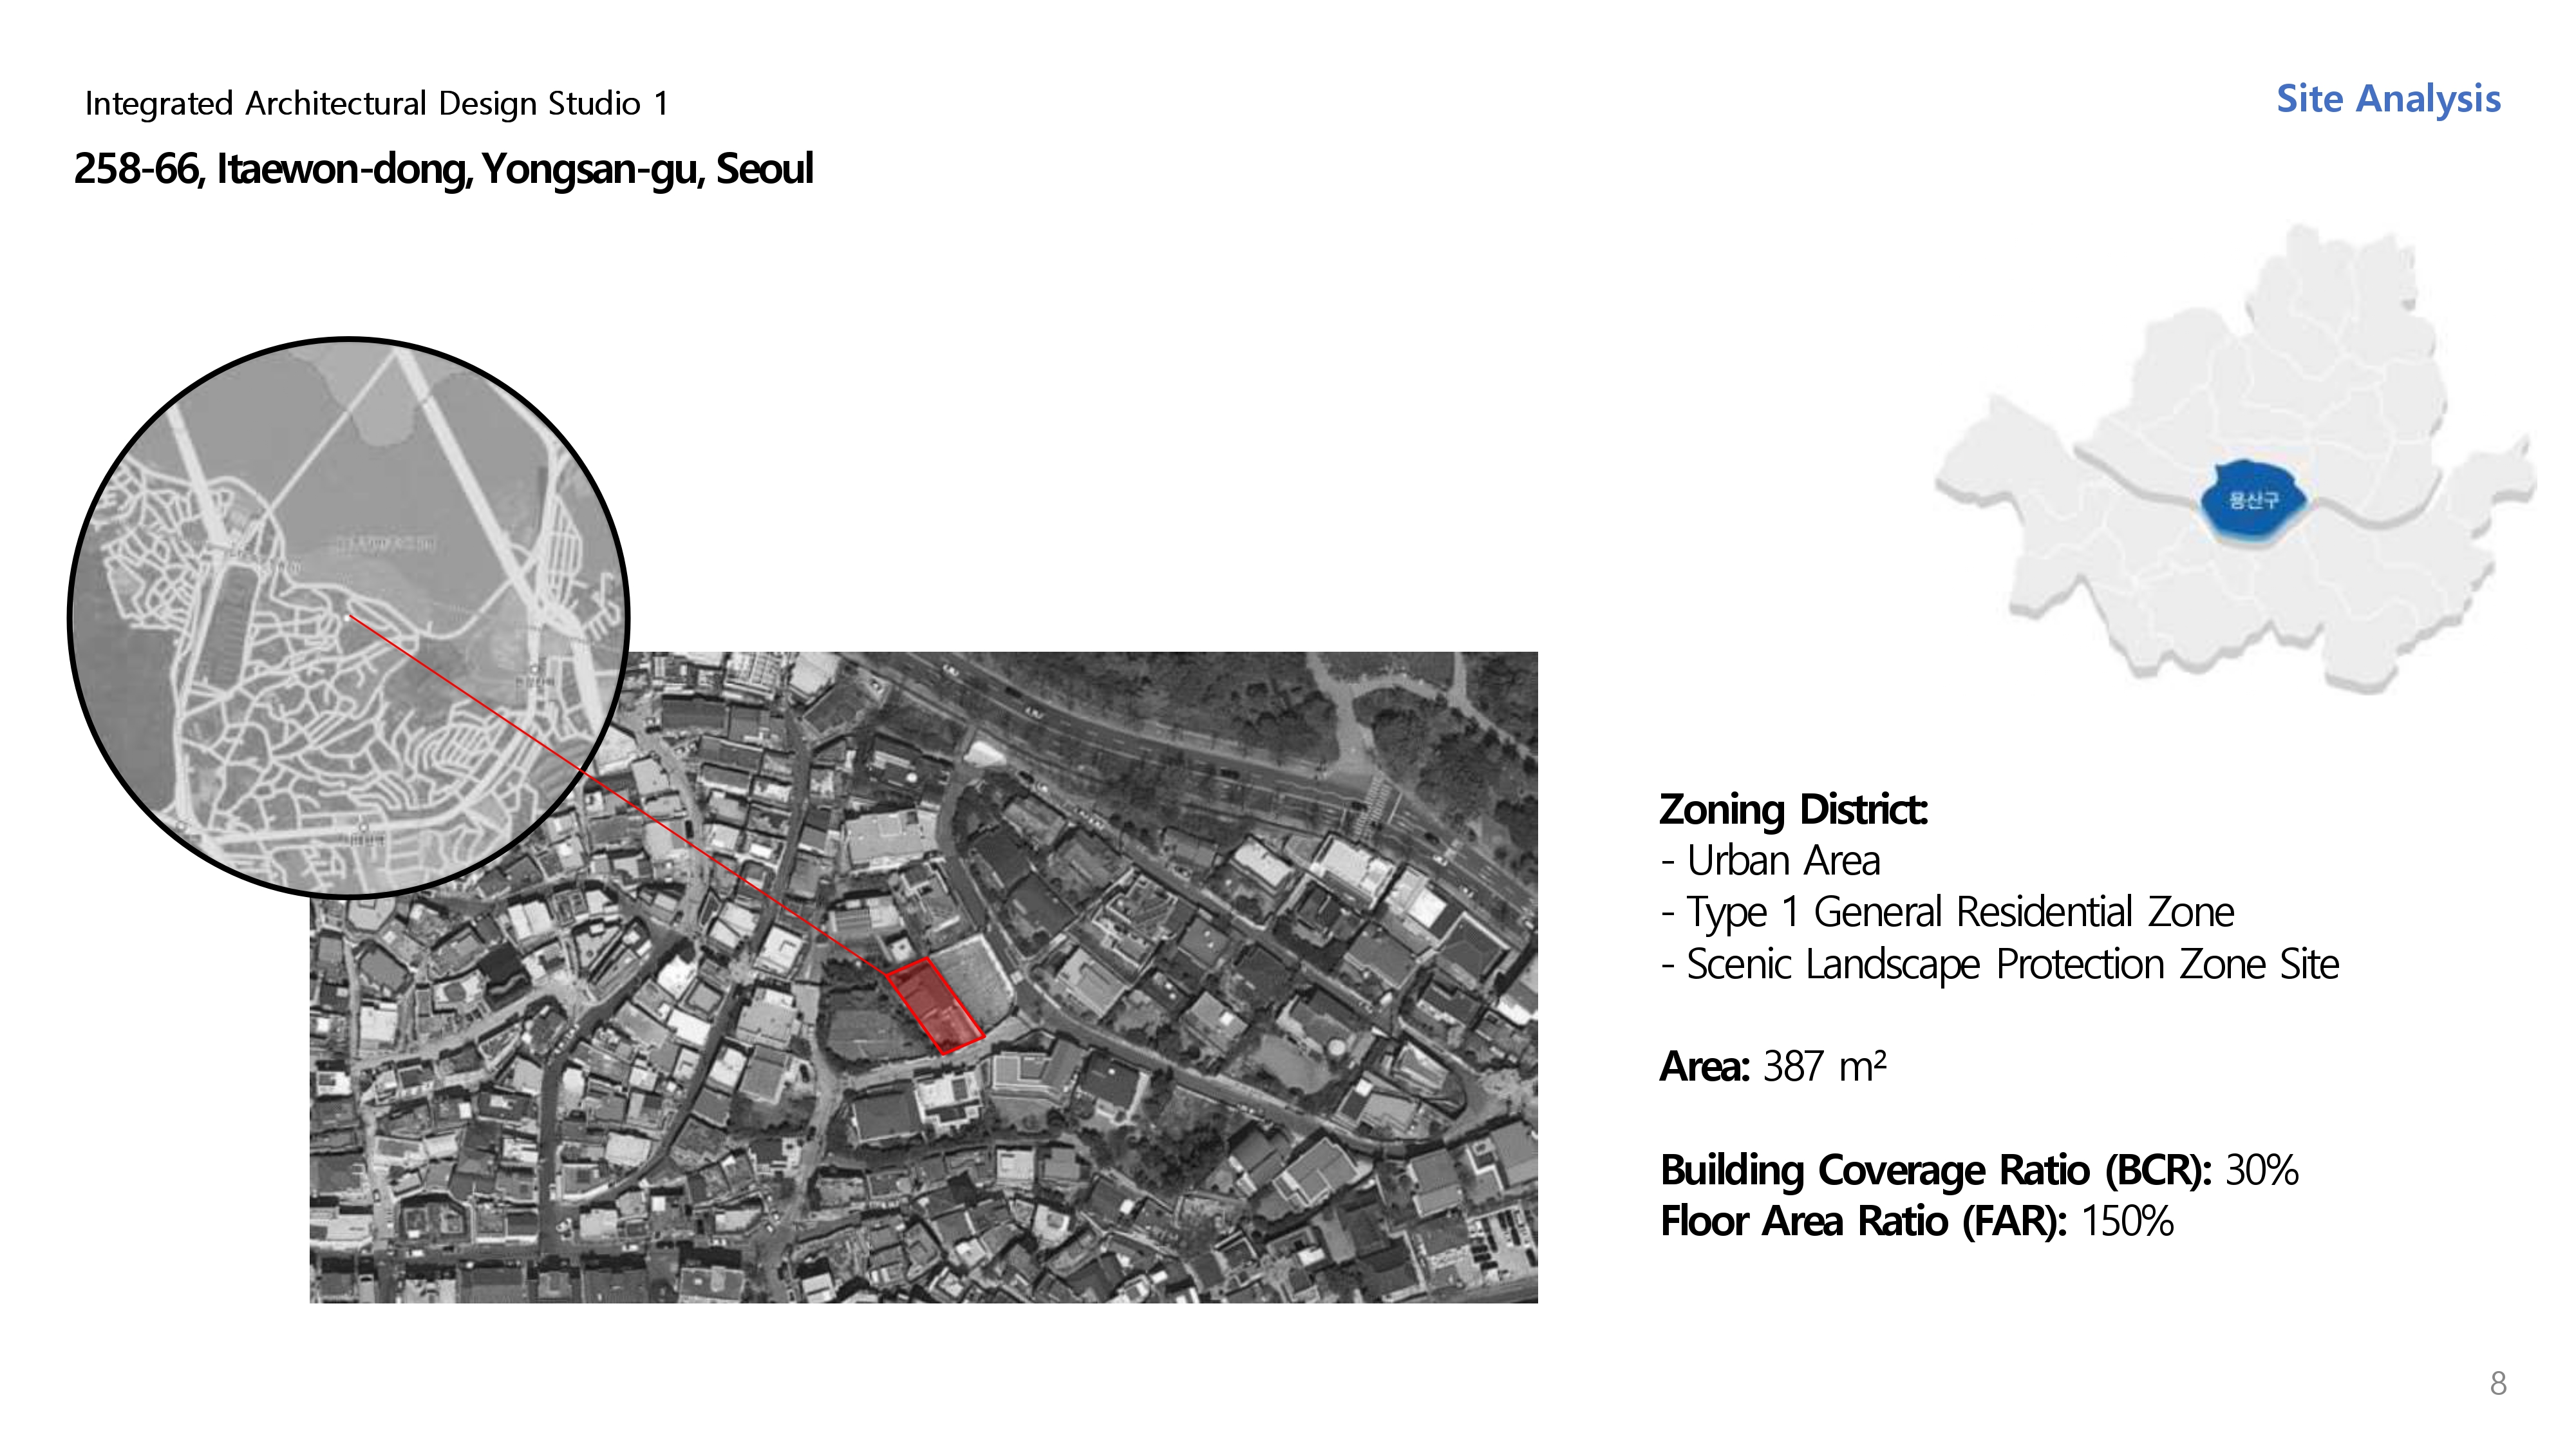
- Information
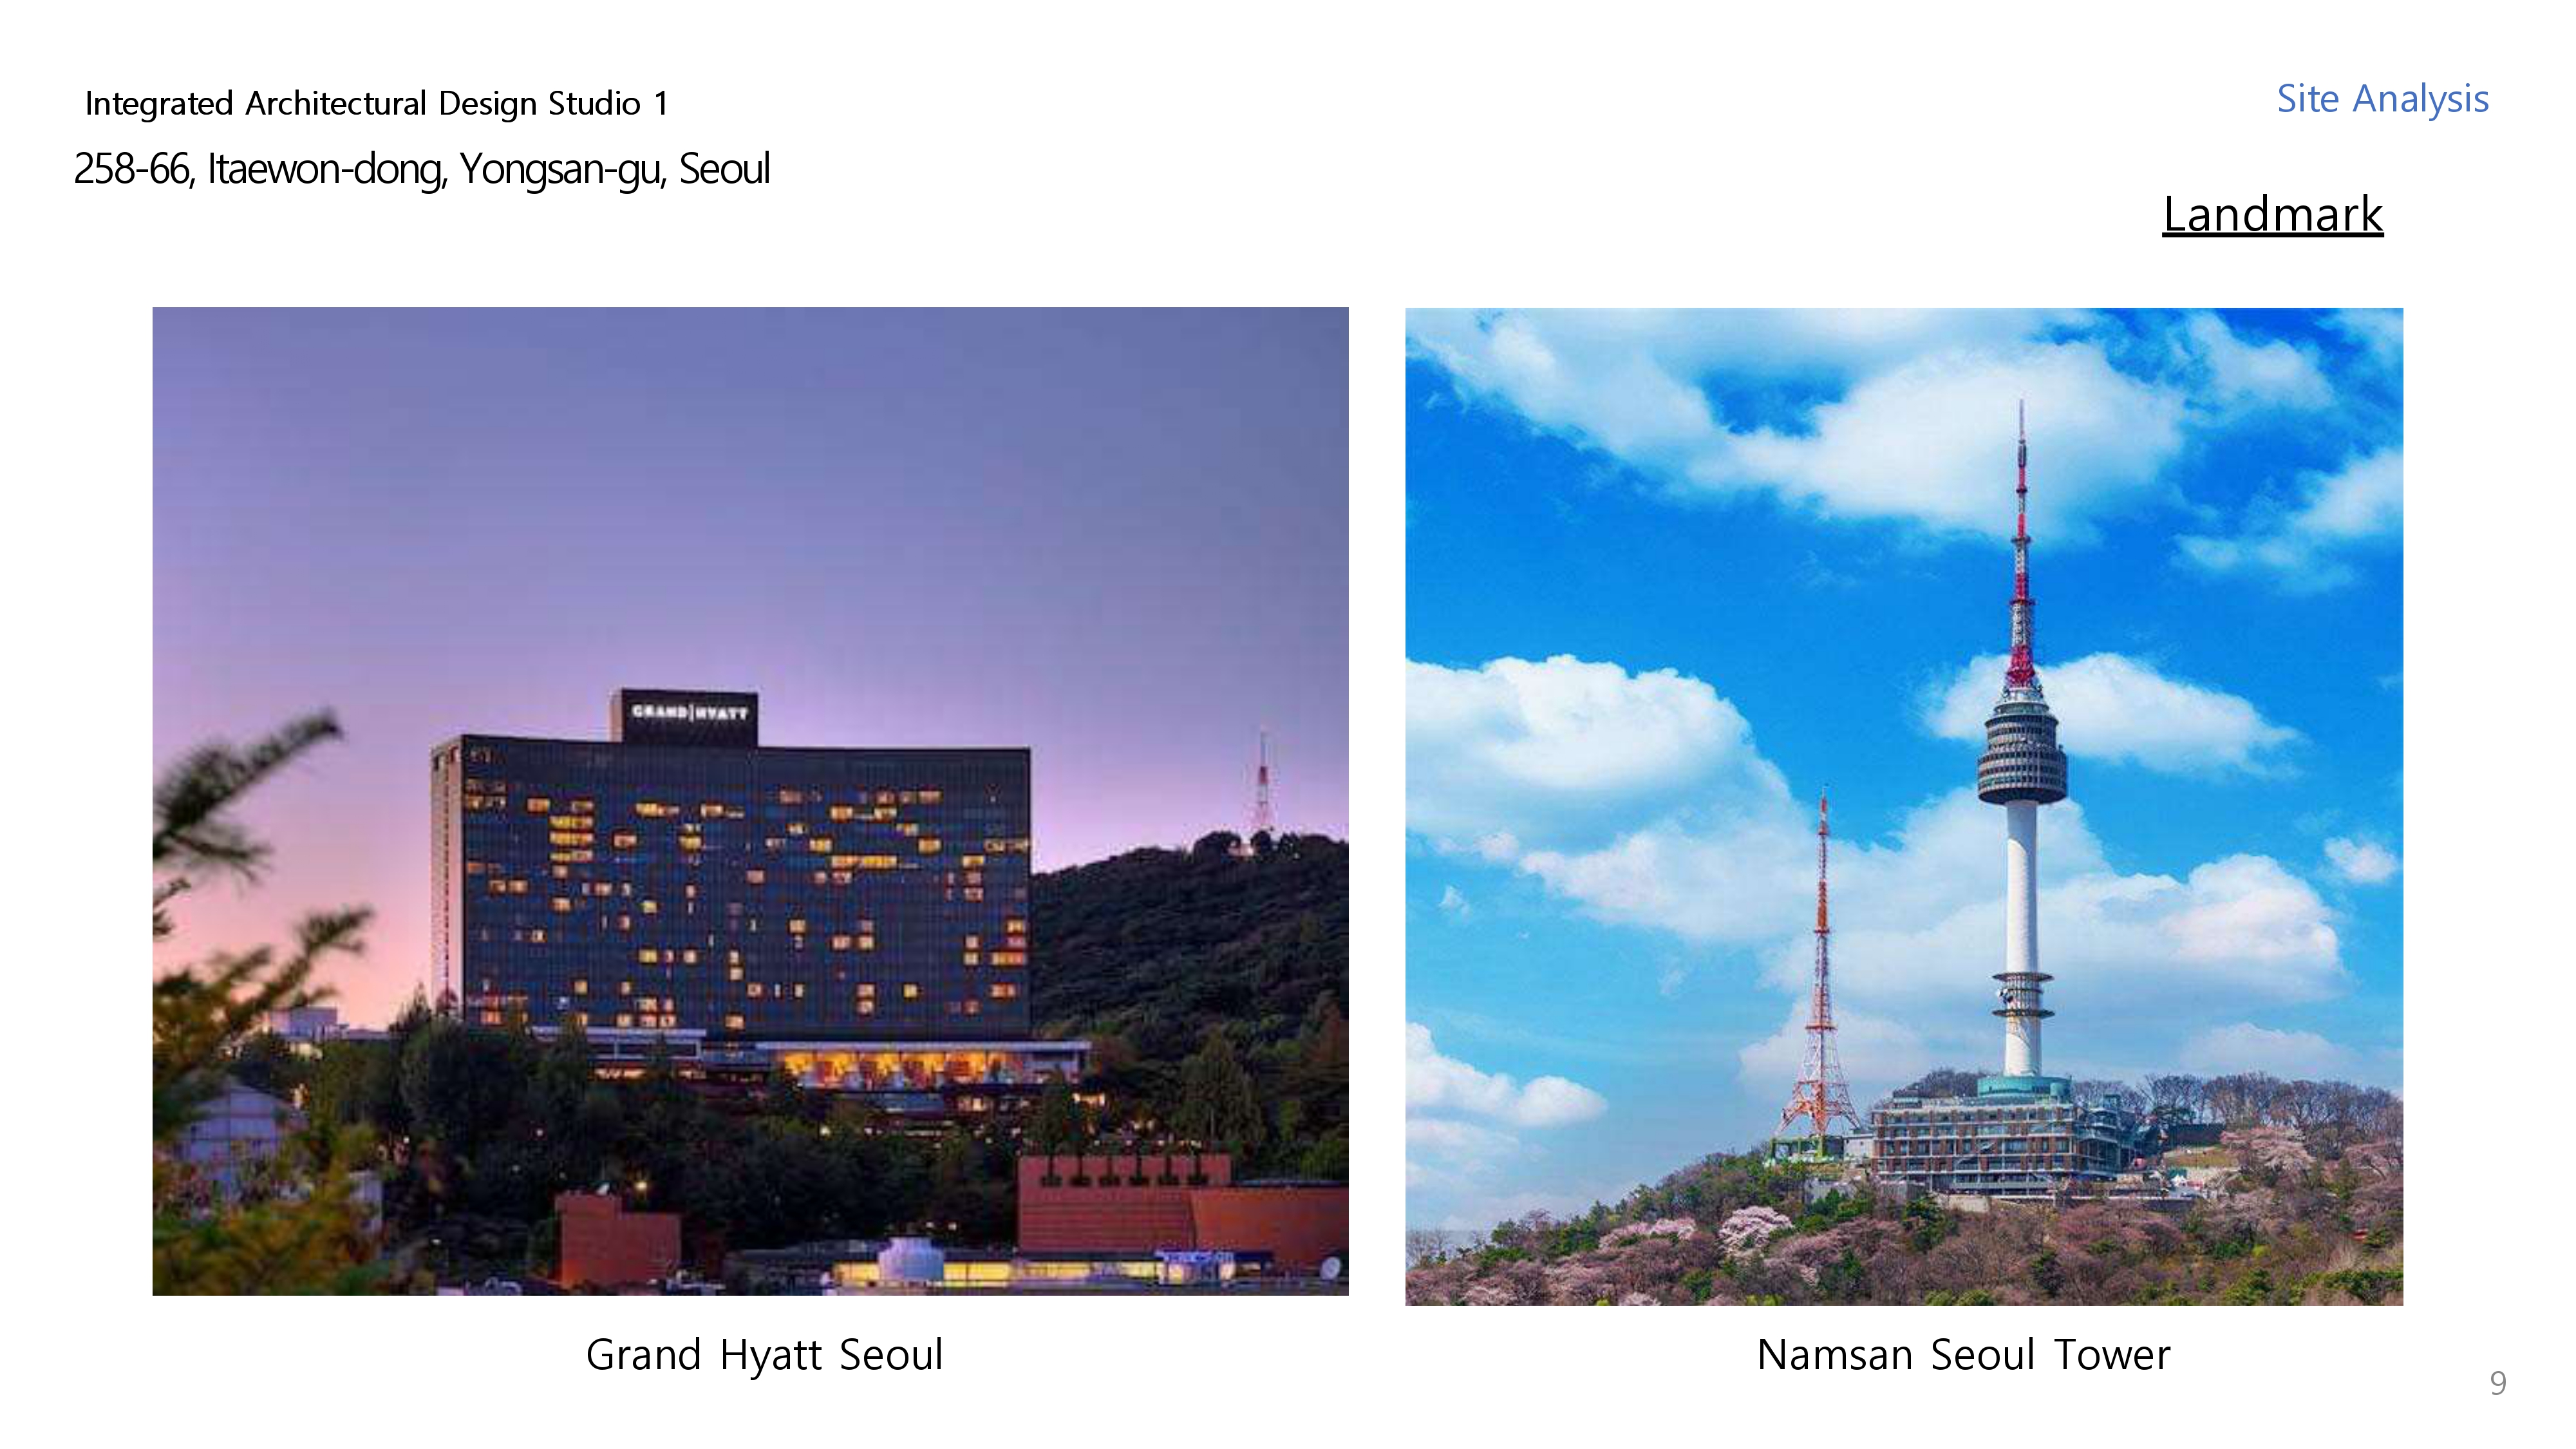
- Landmarks & Institutions
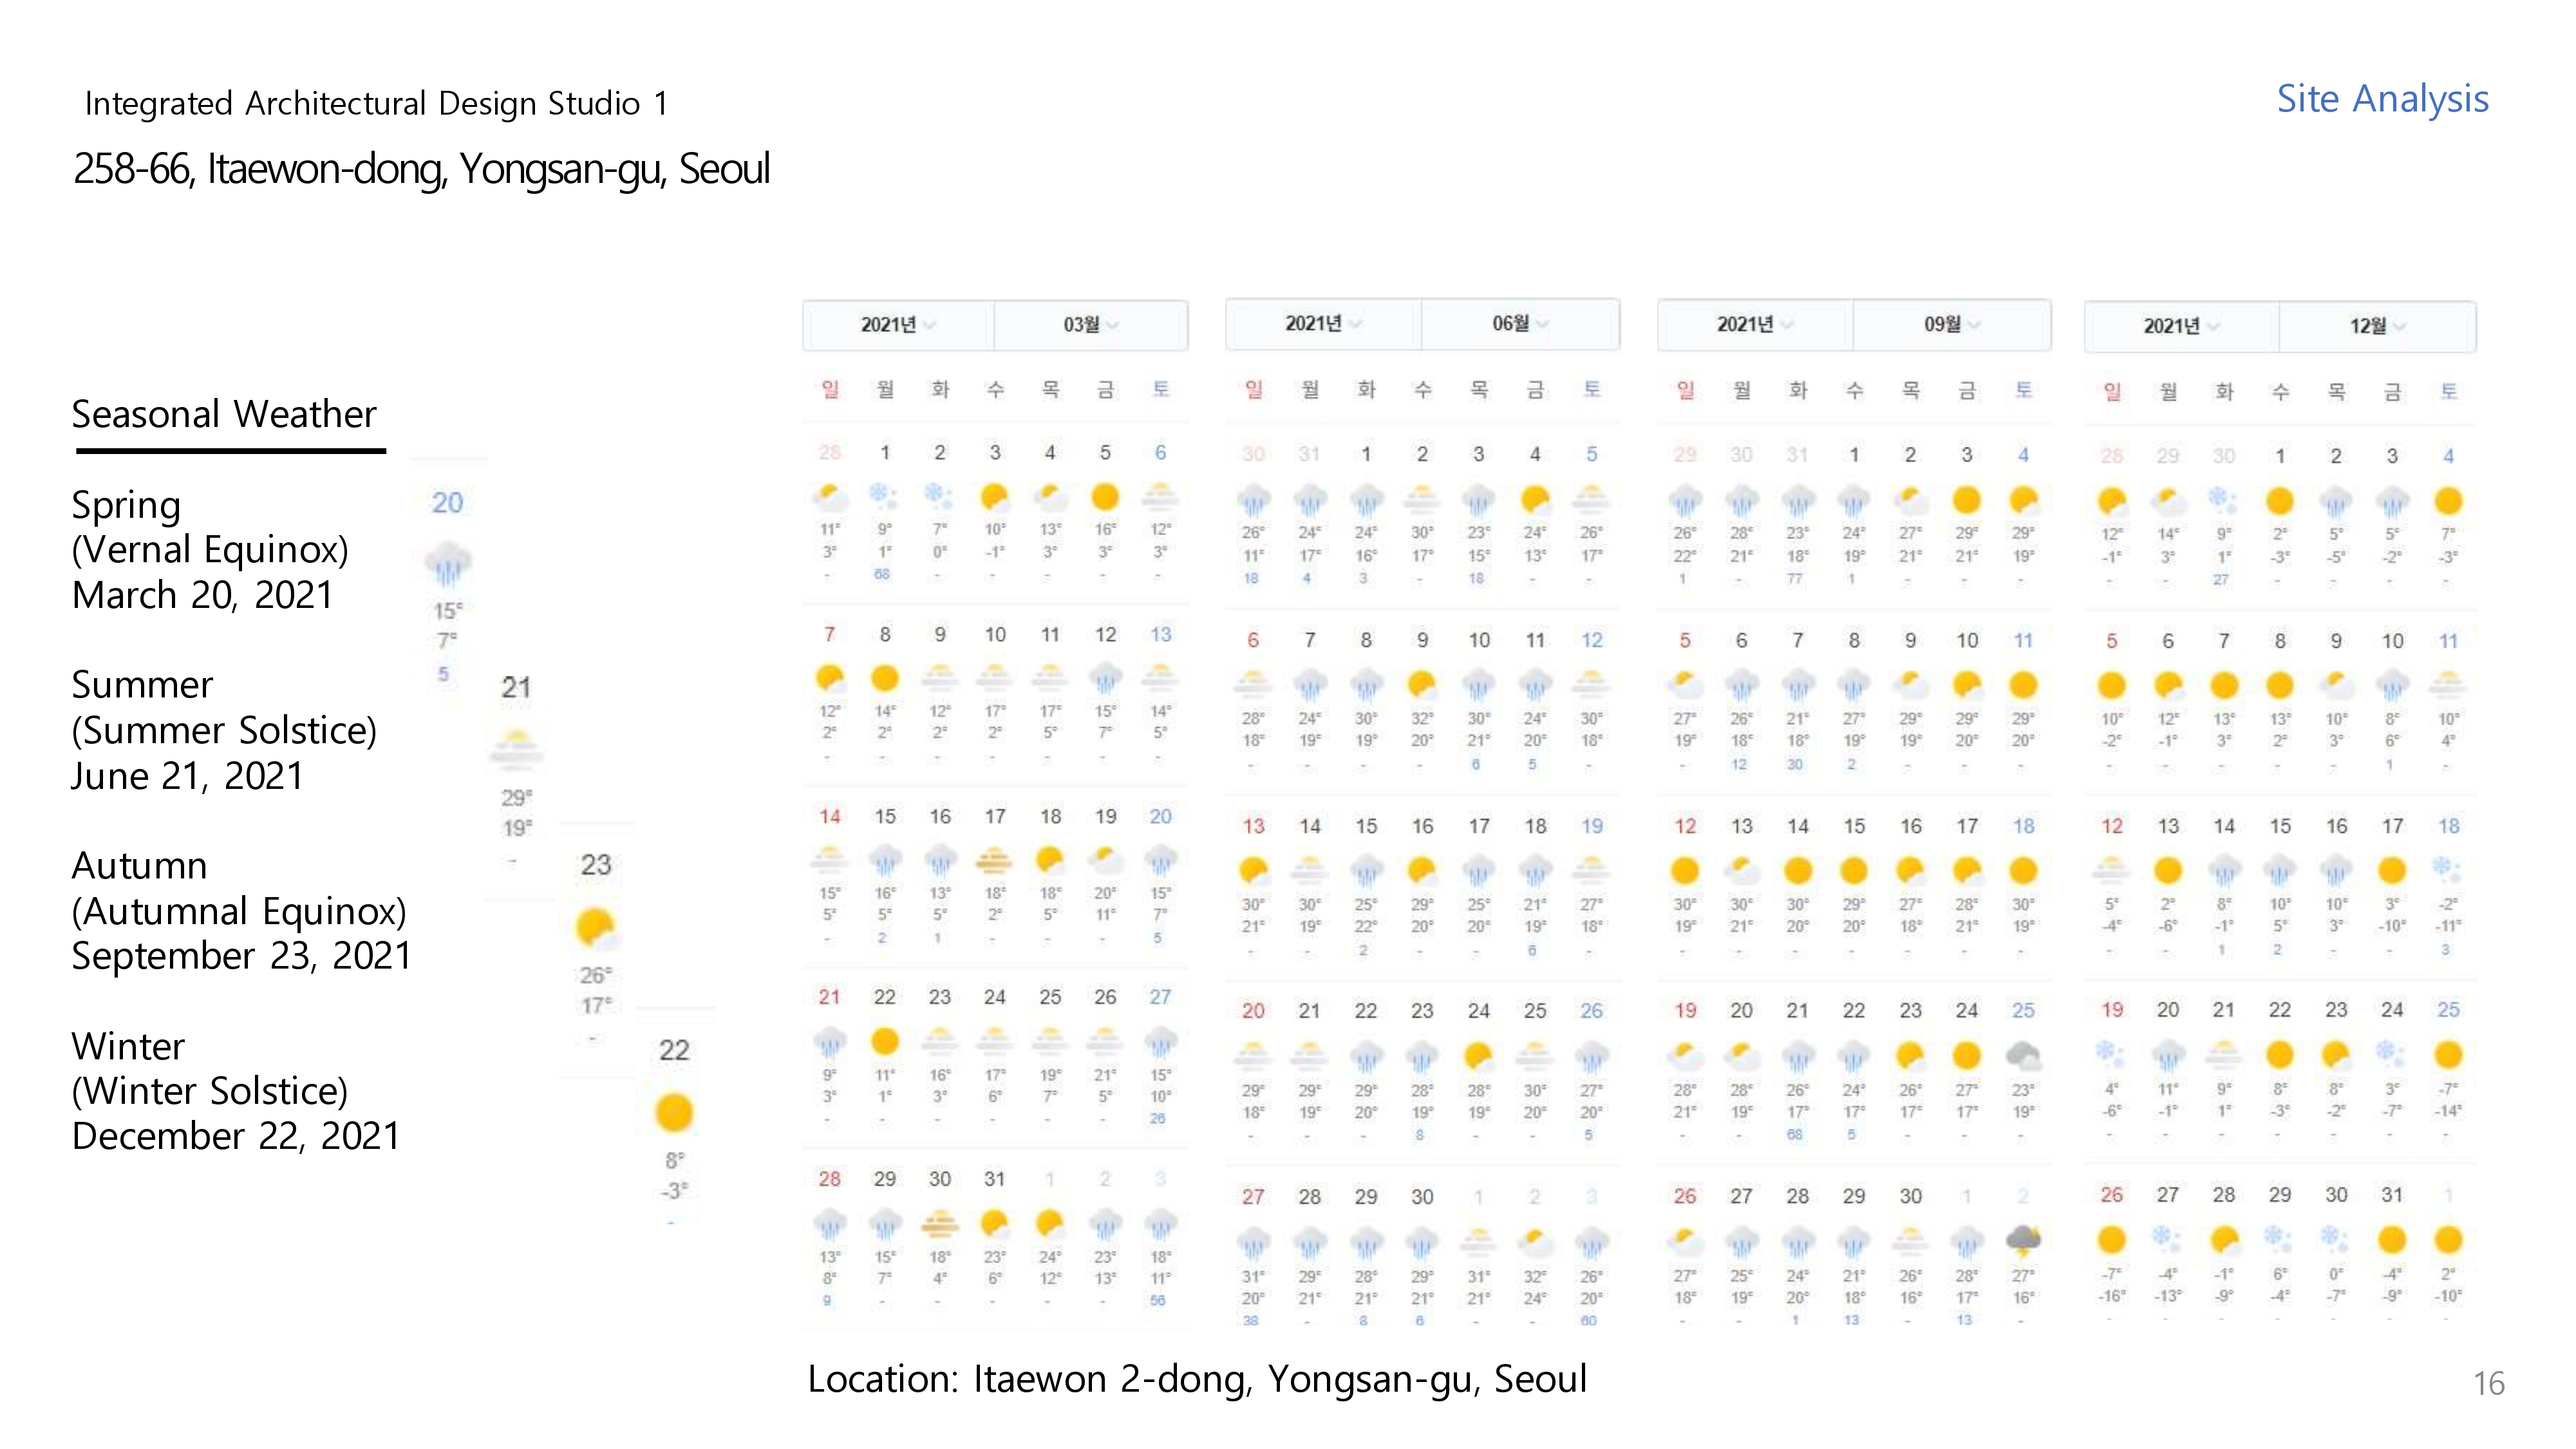
- Topography & Weather
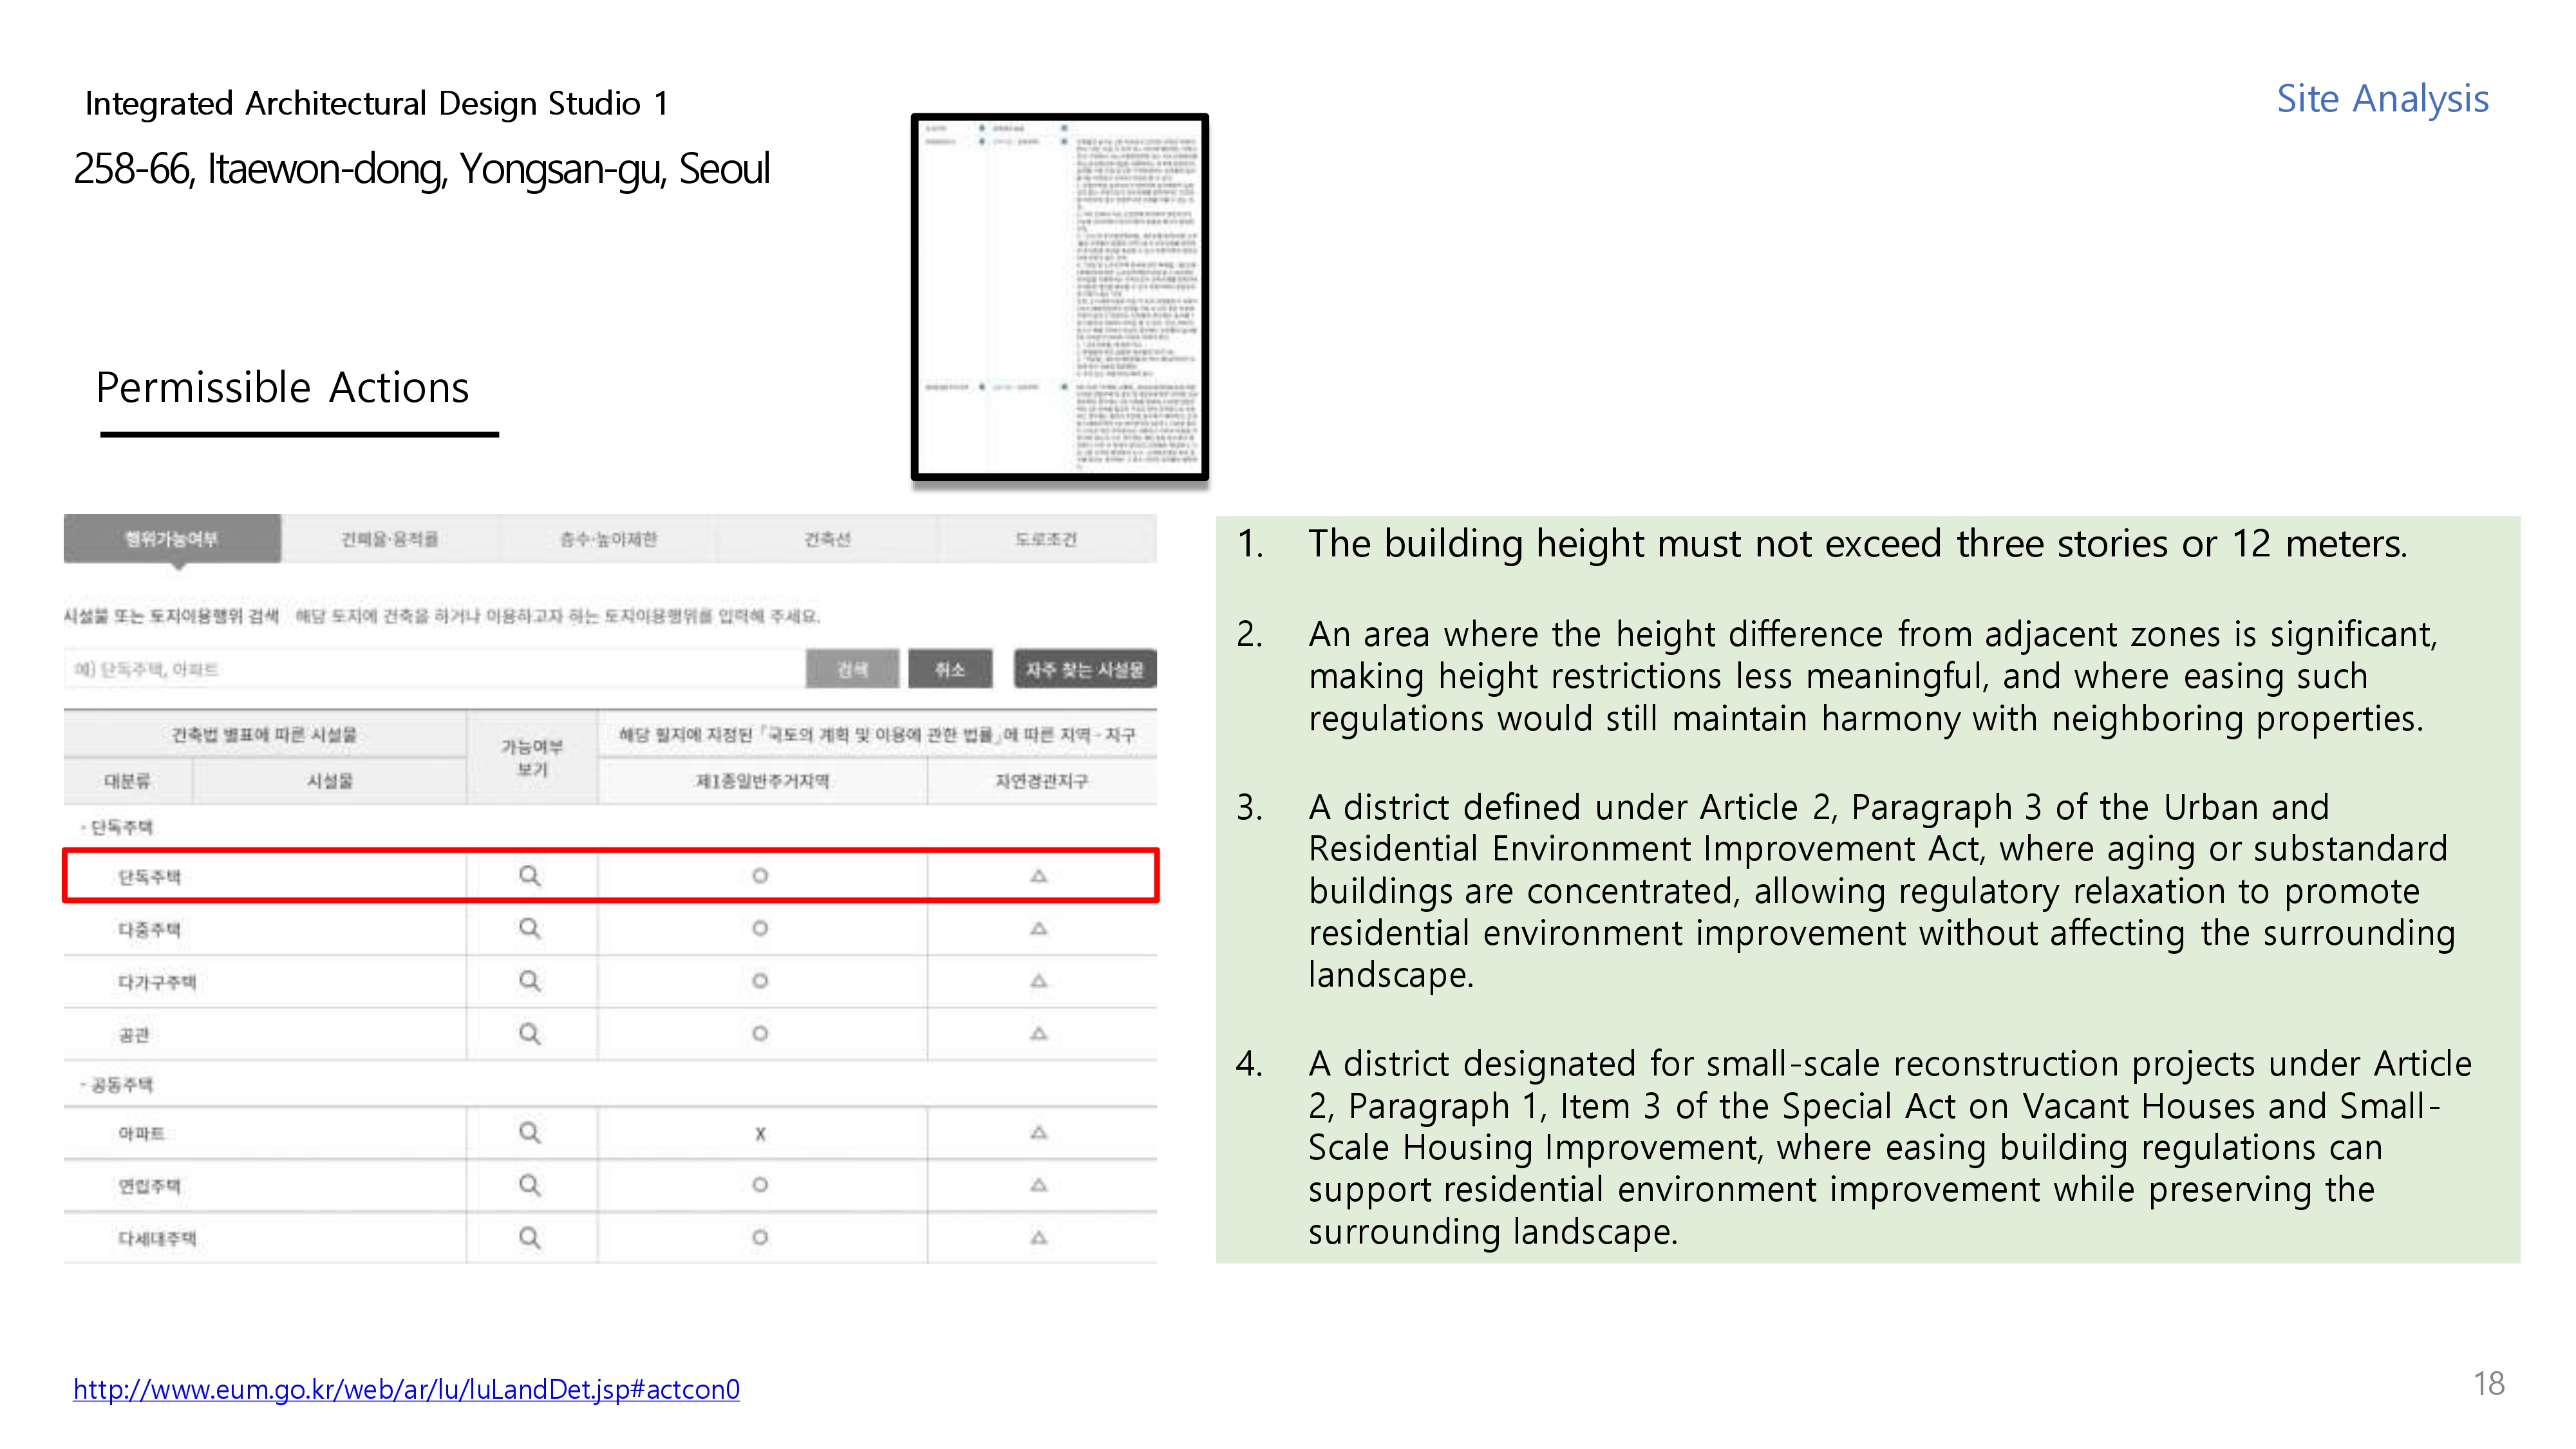
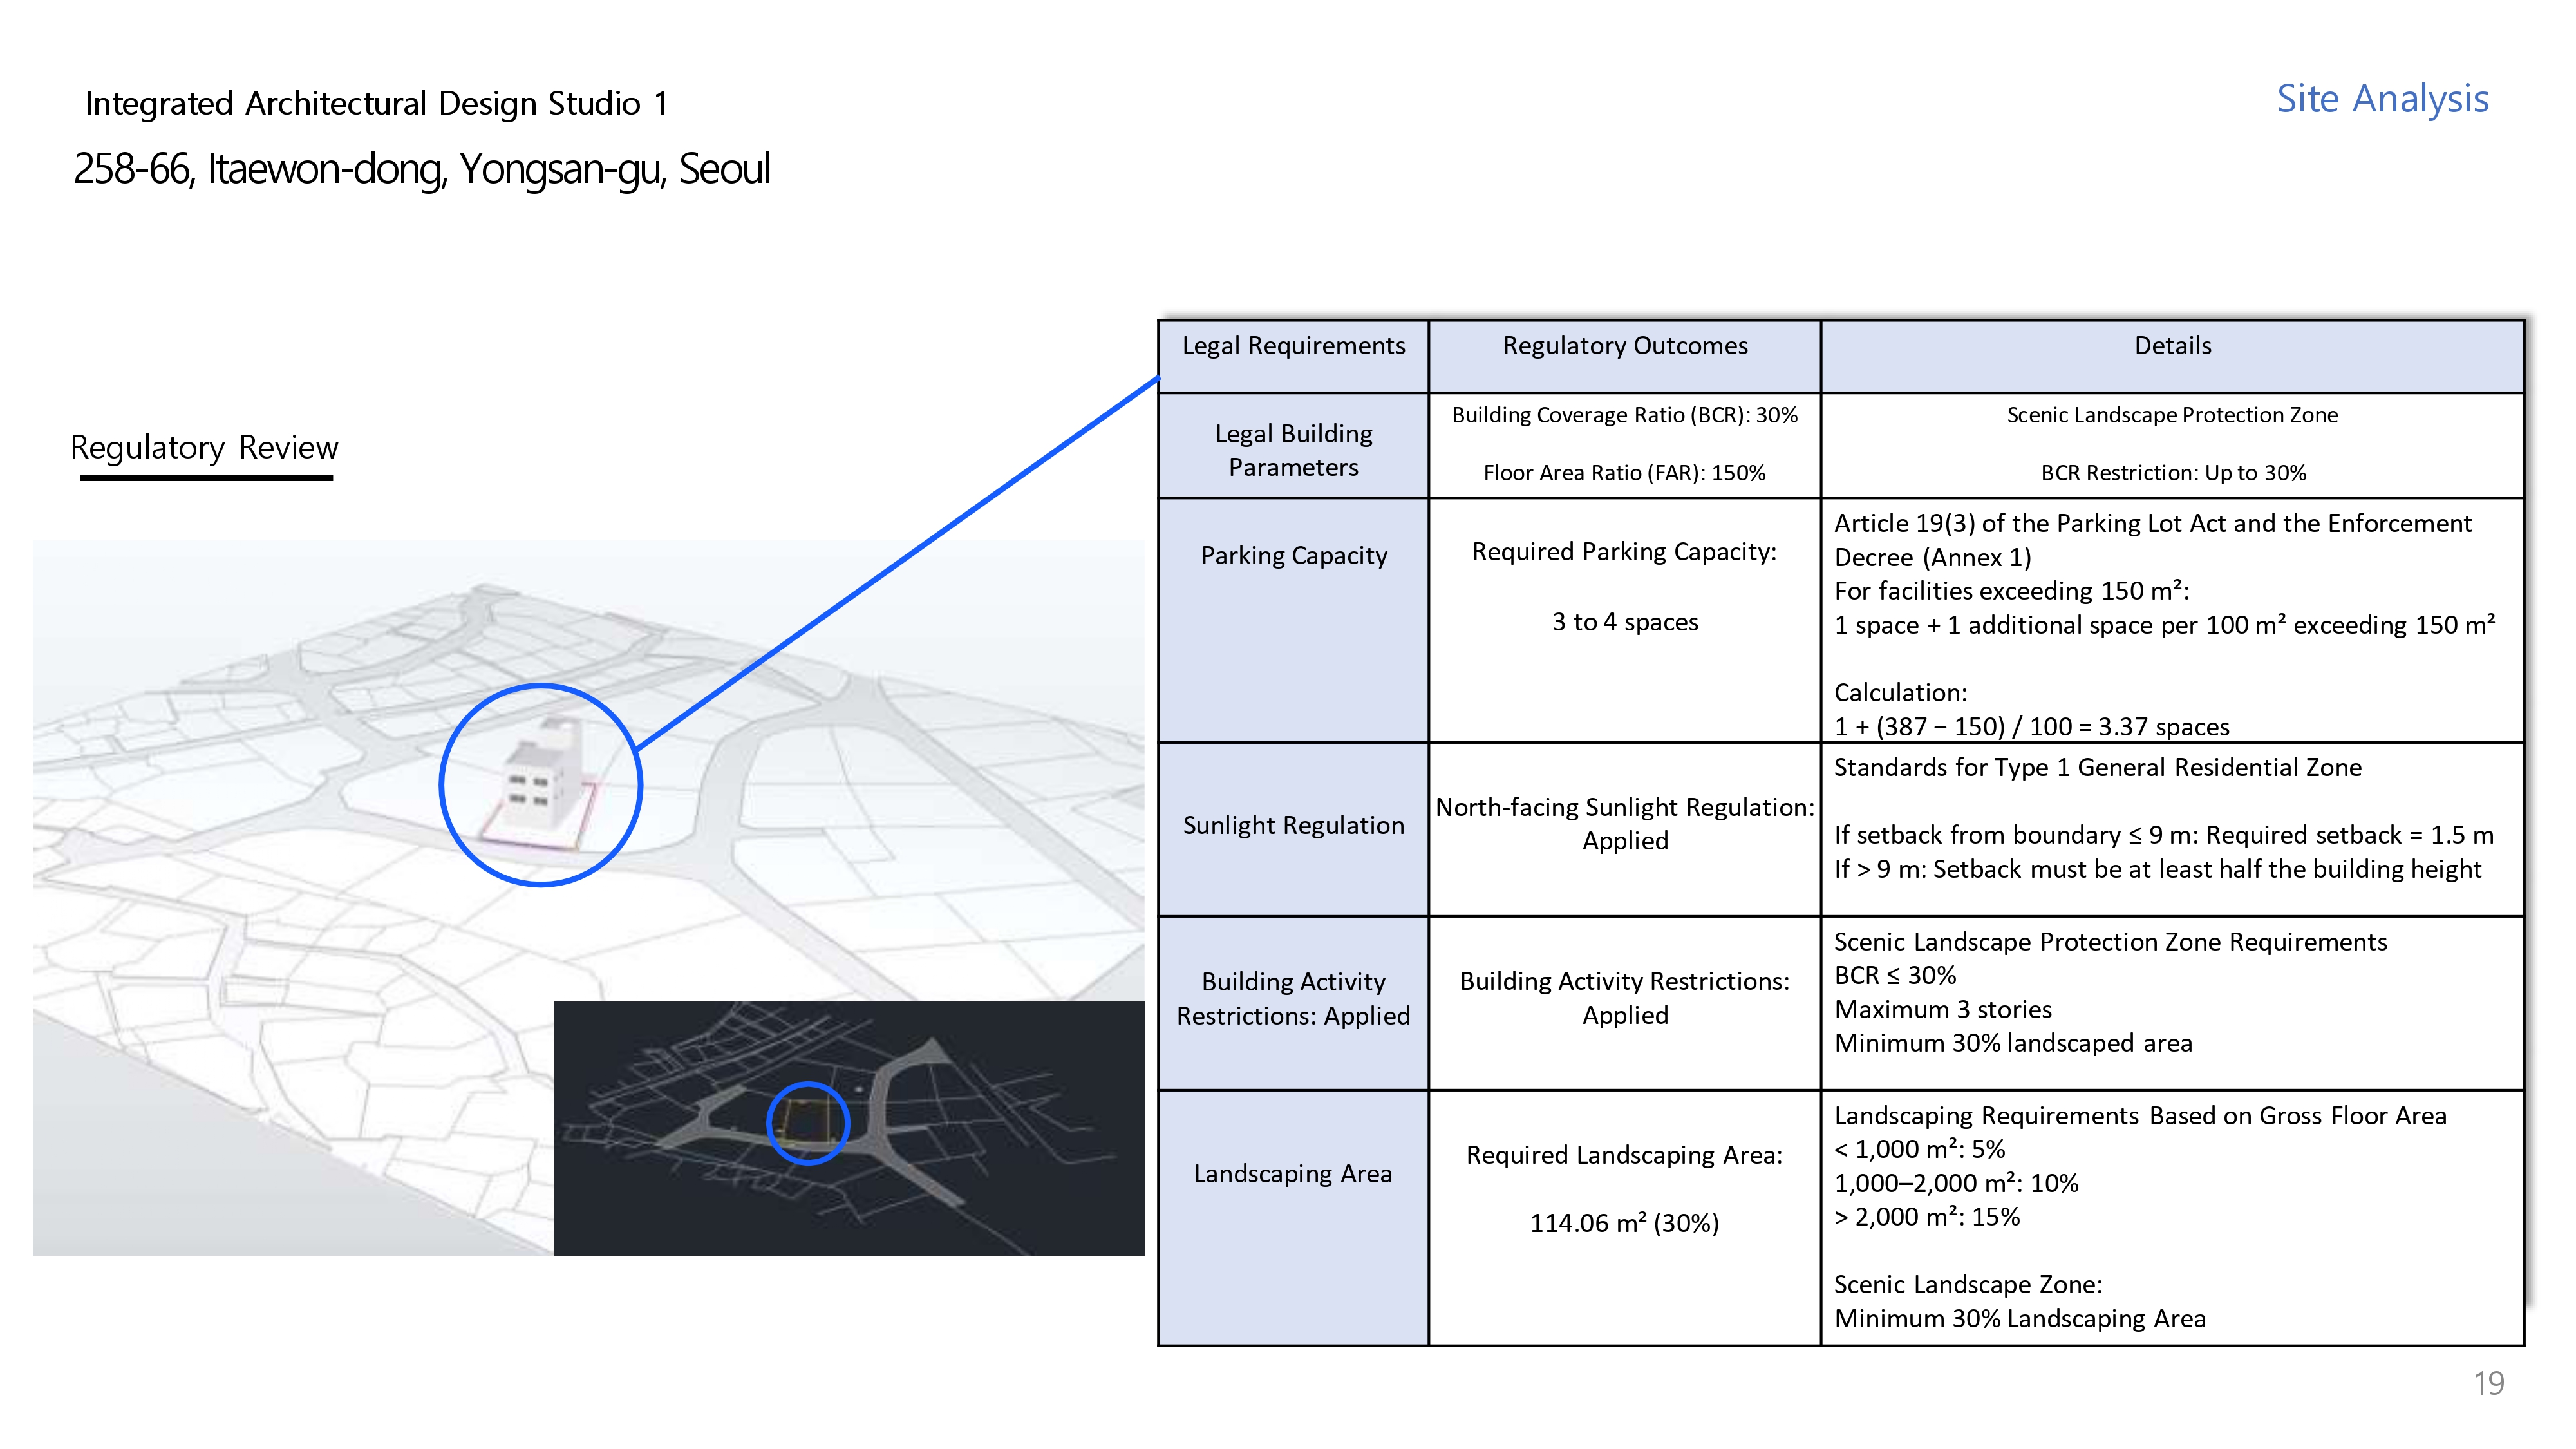
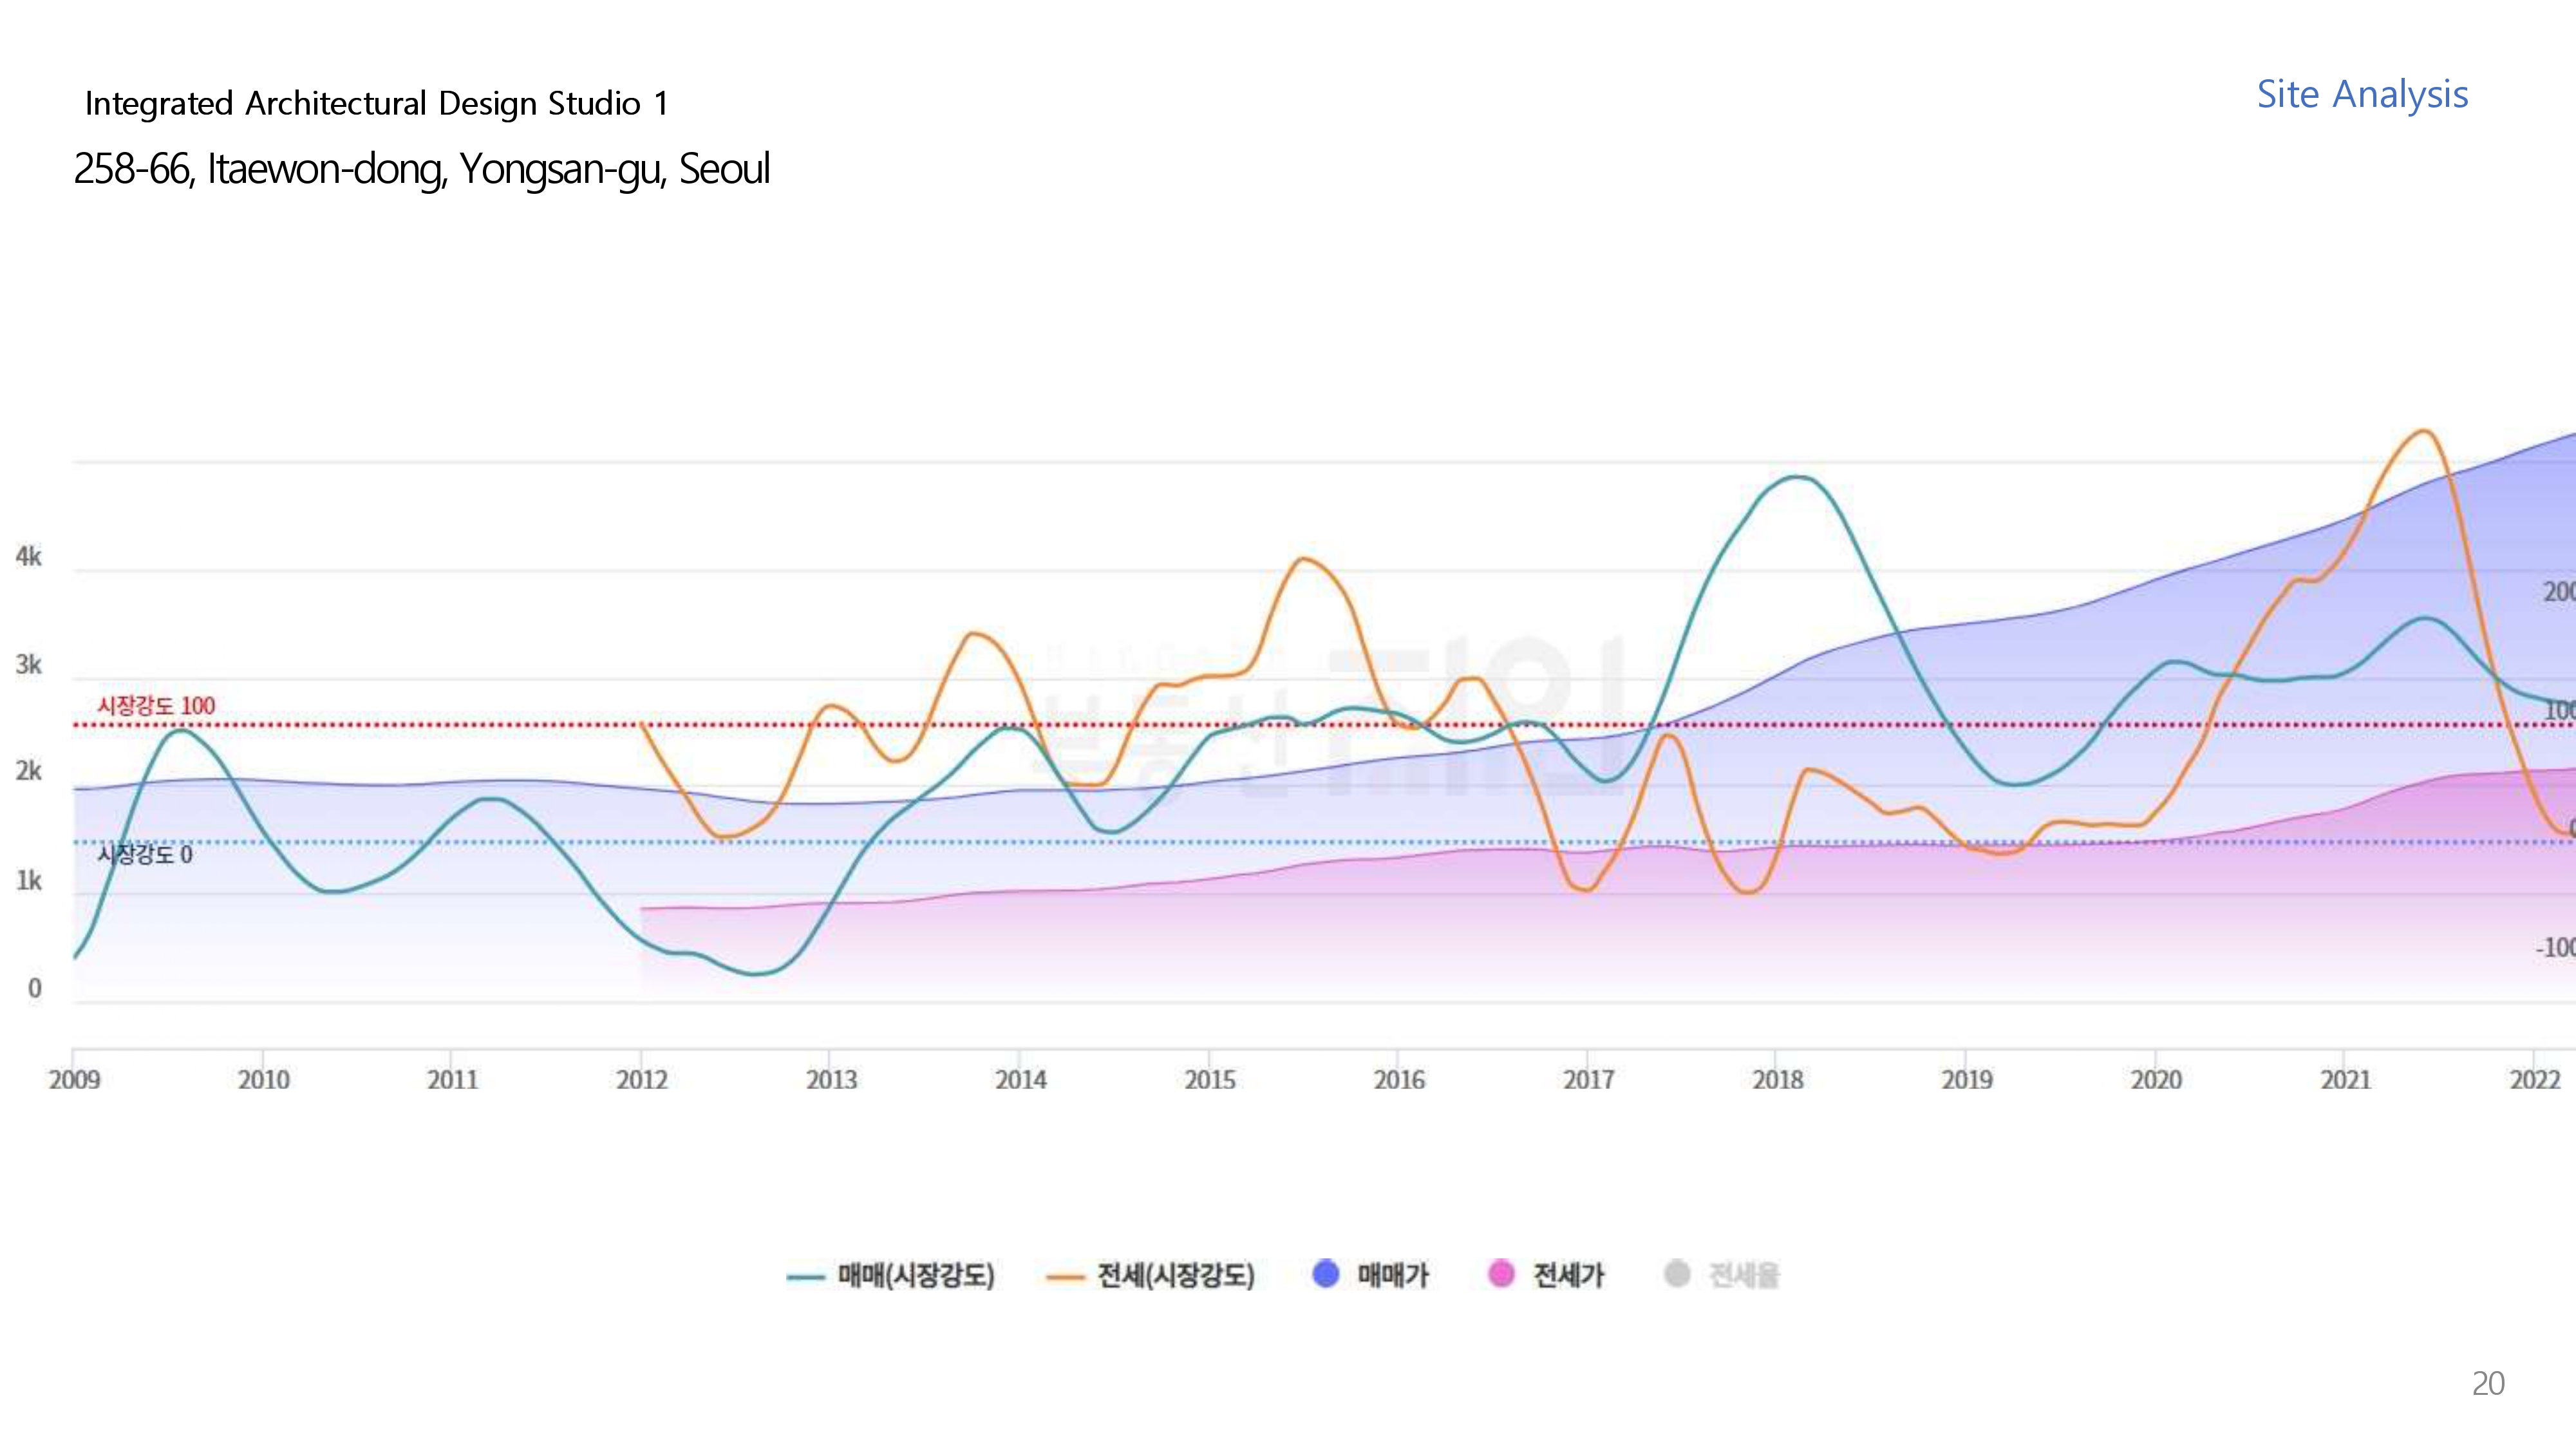
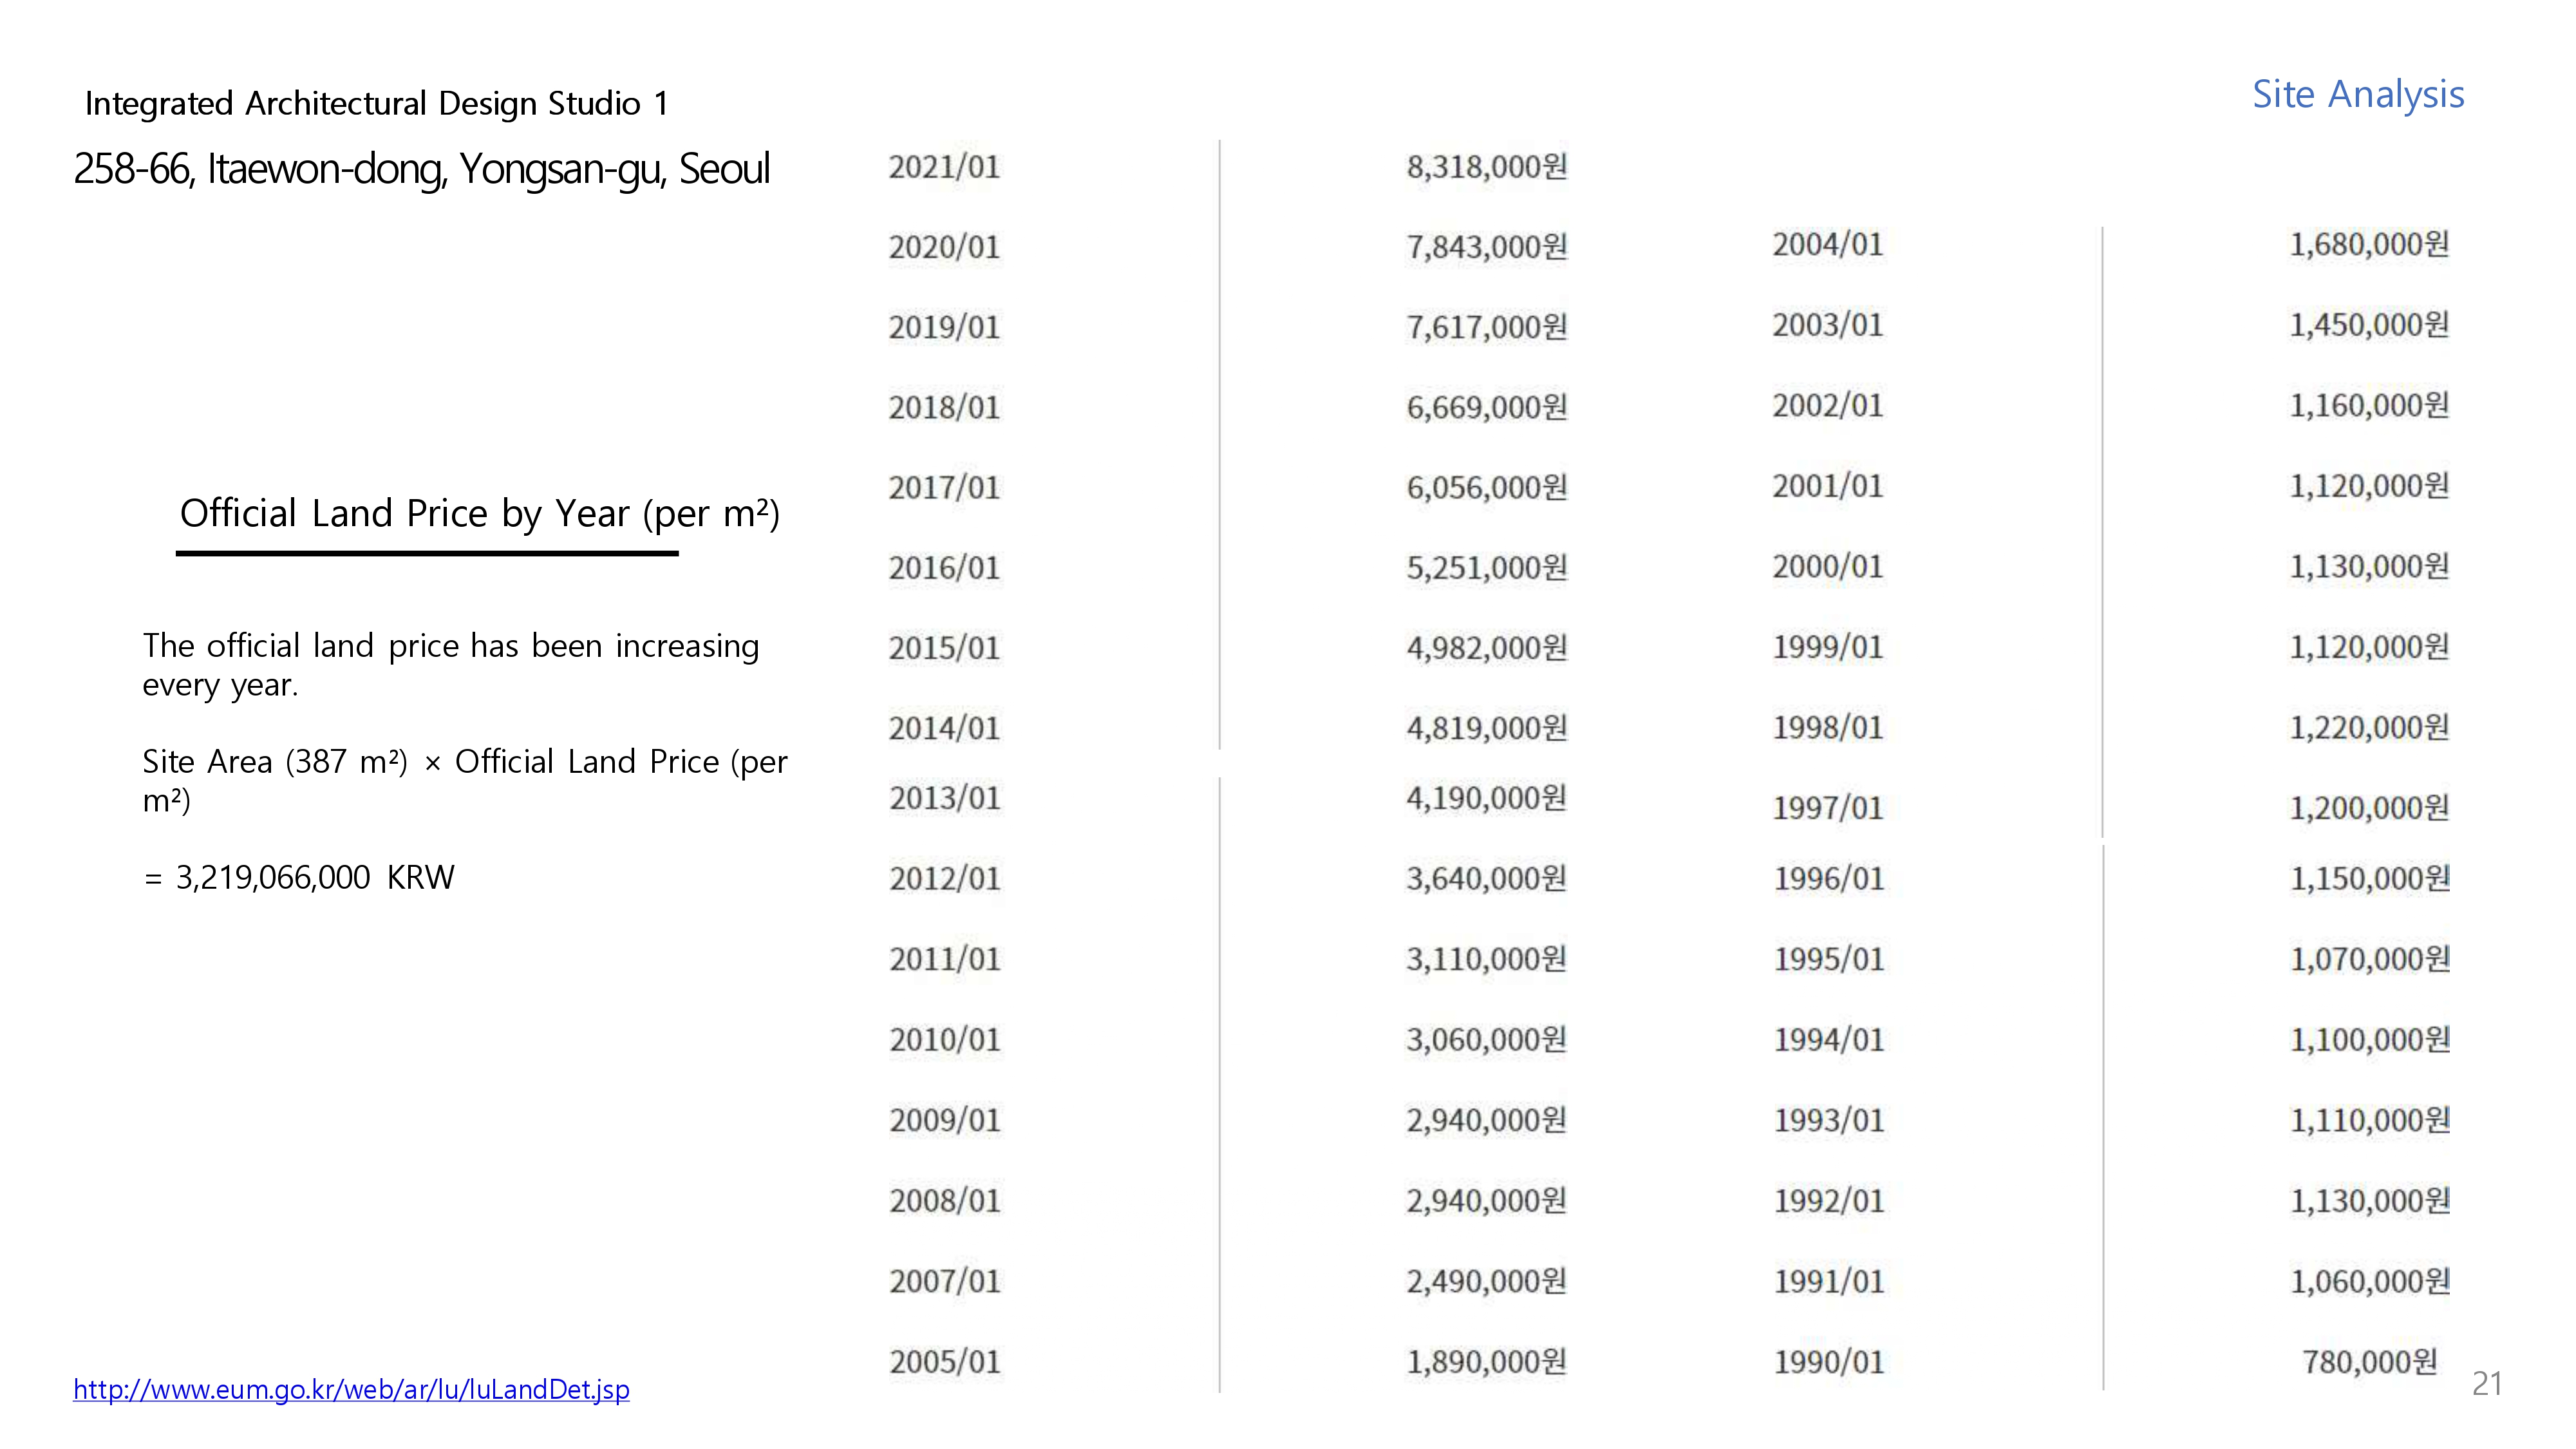
- Regulation
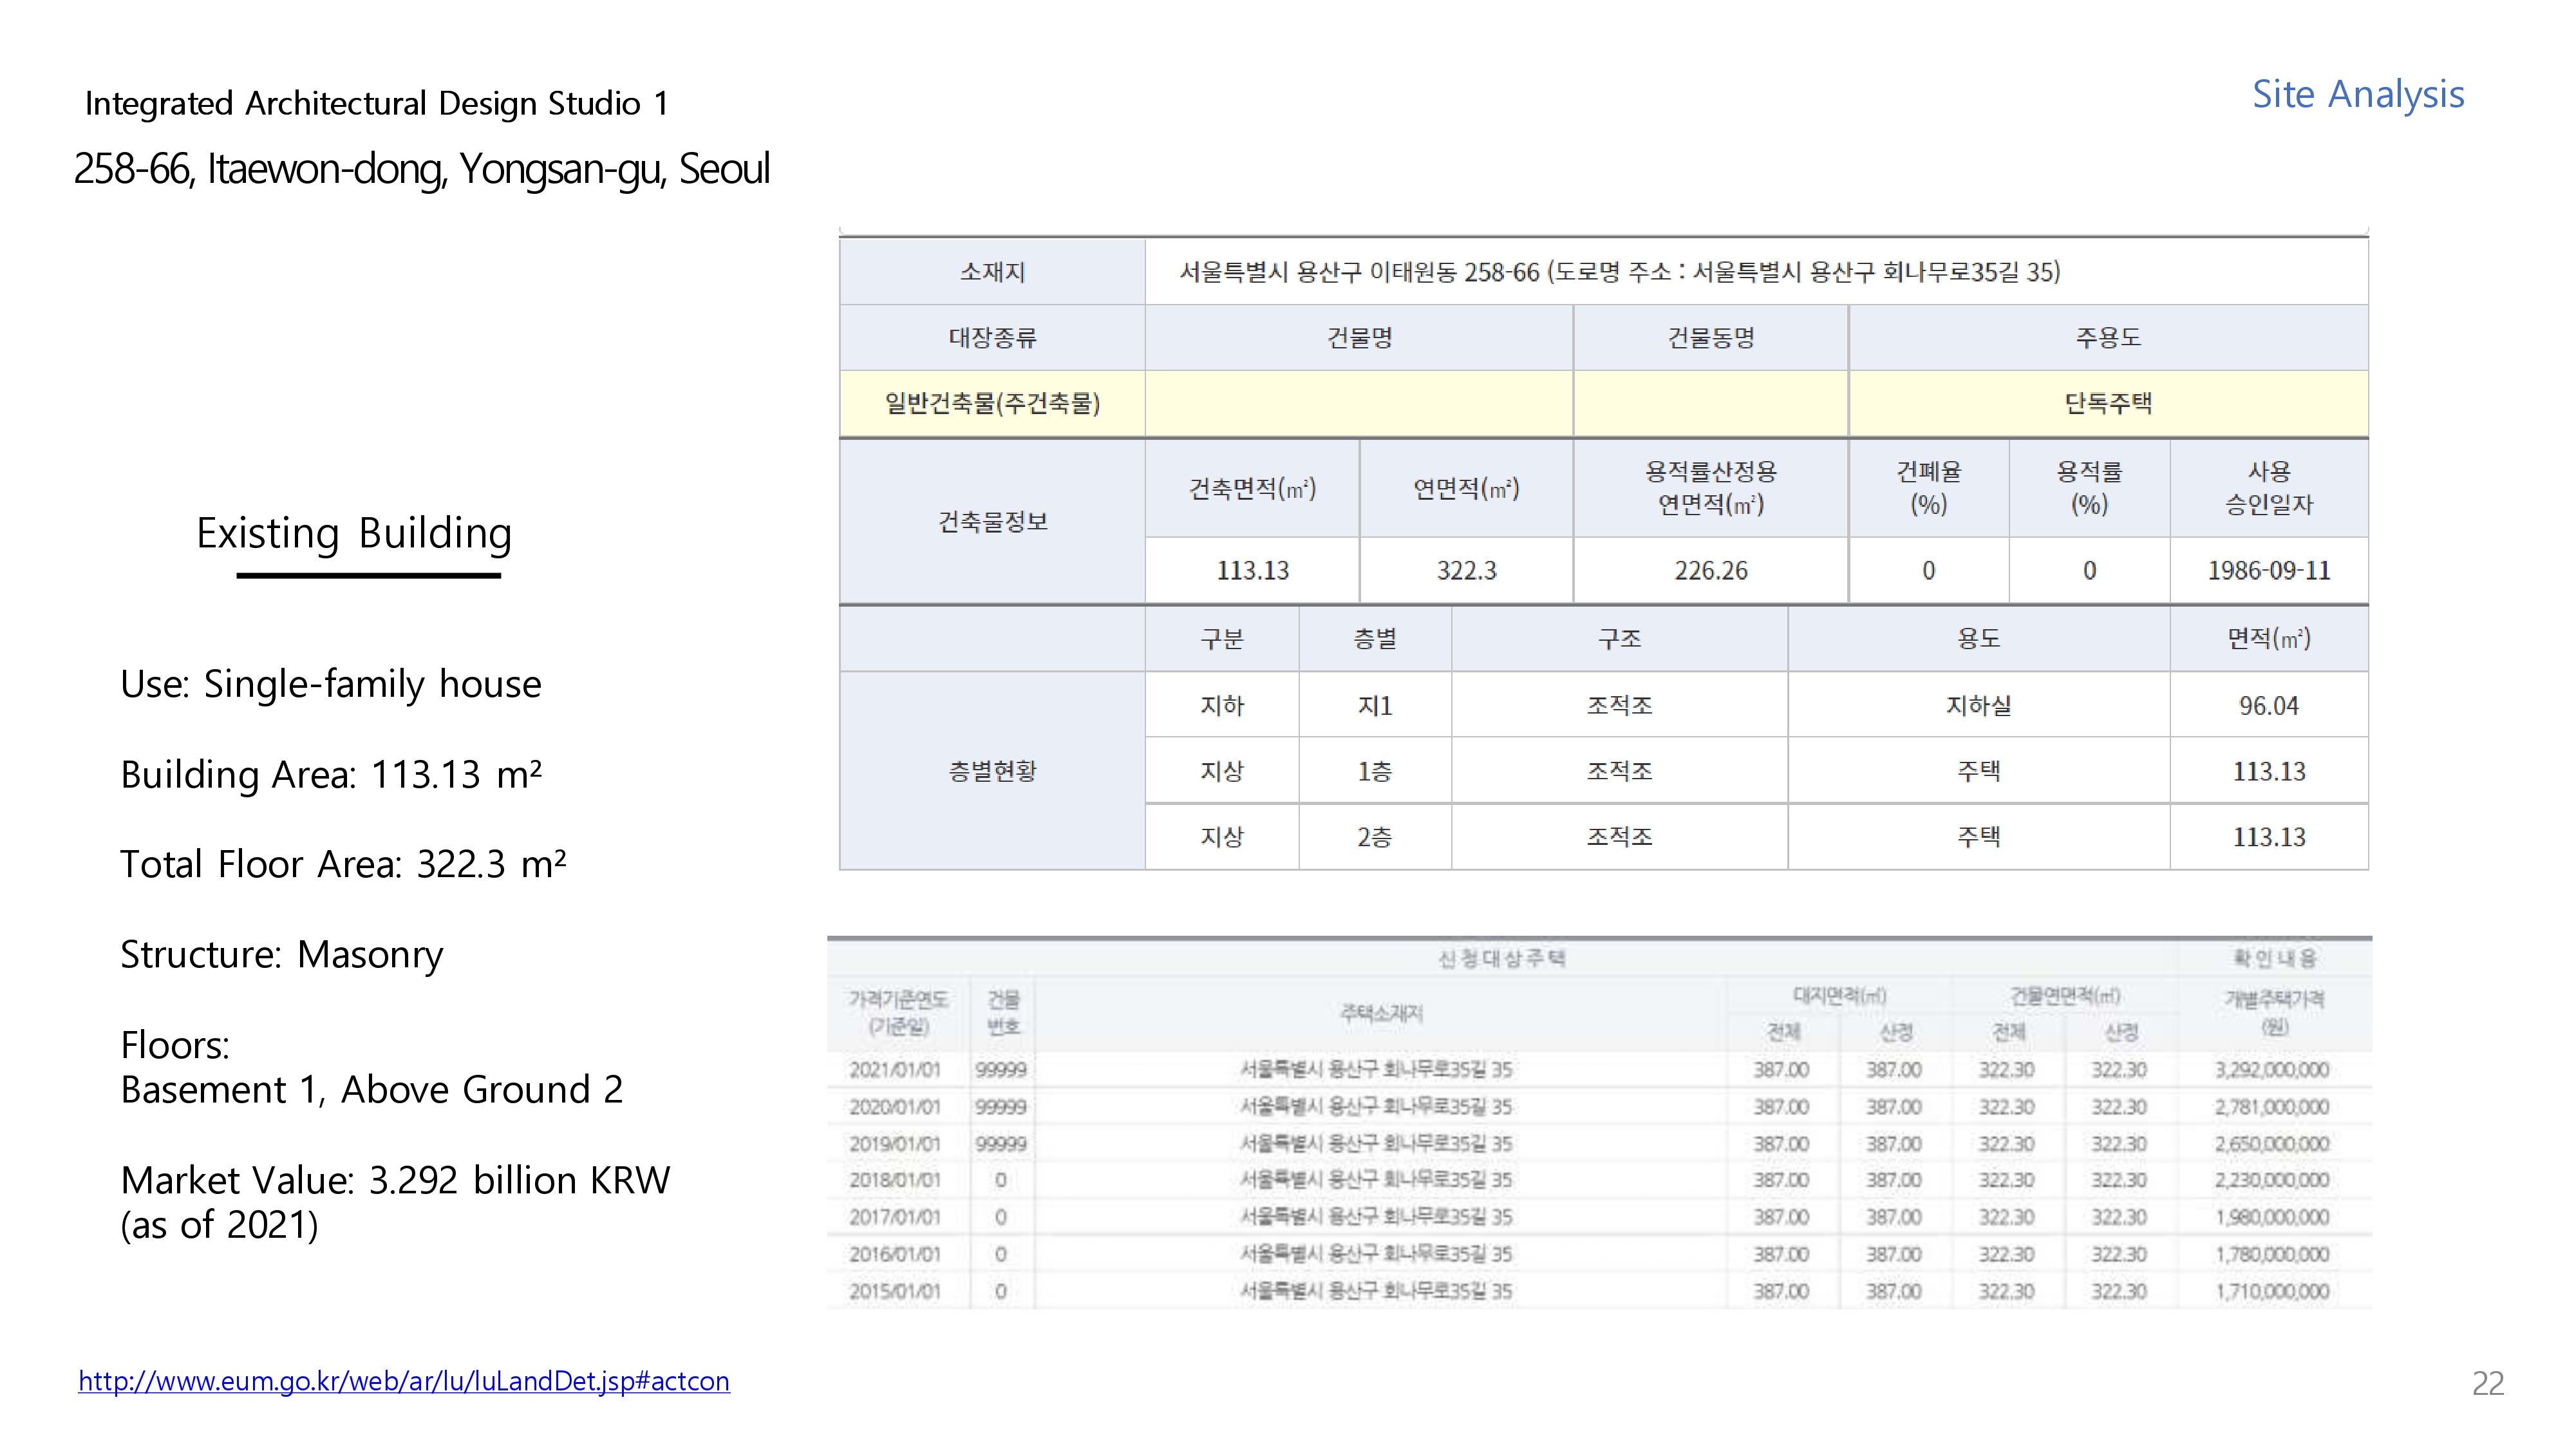
- Regulatory Review, Land Price, Existing Building
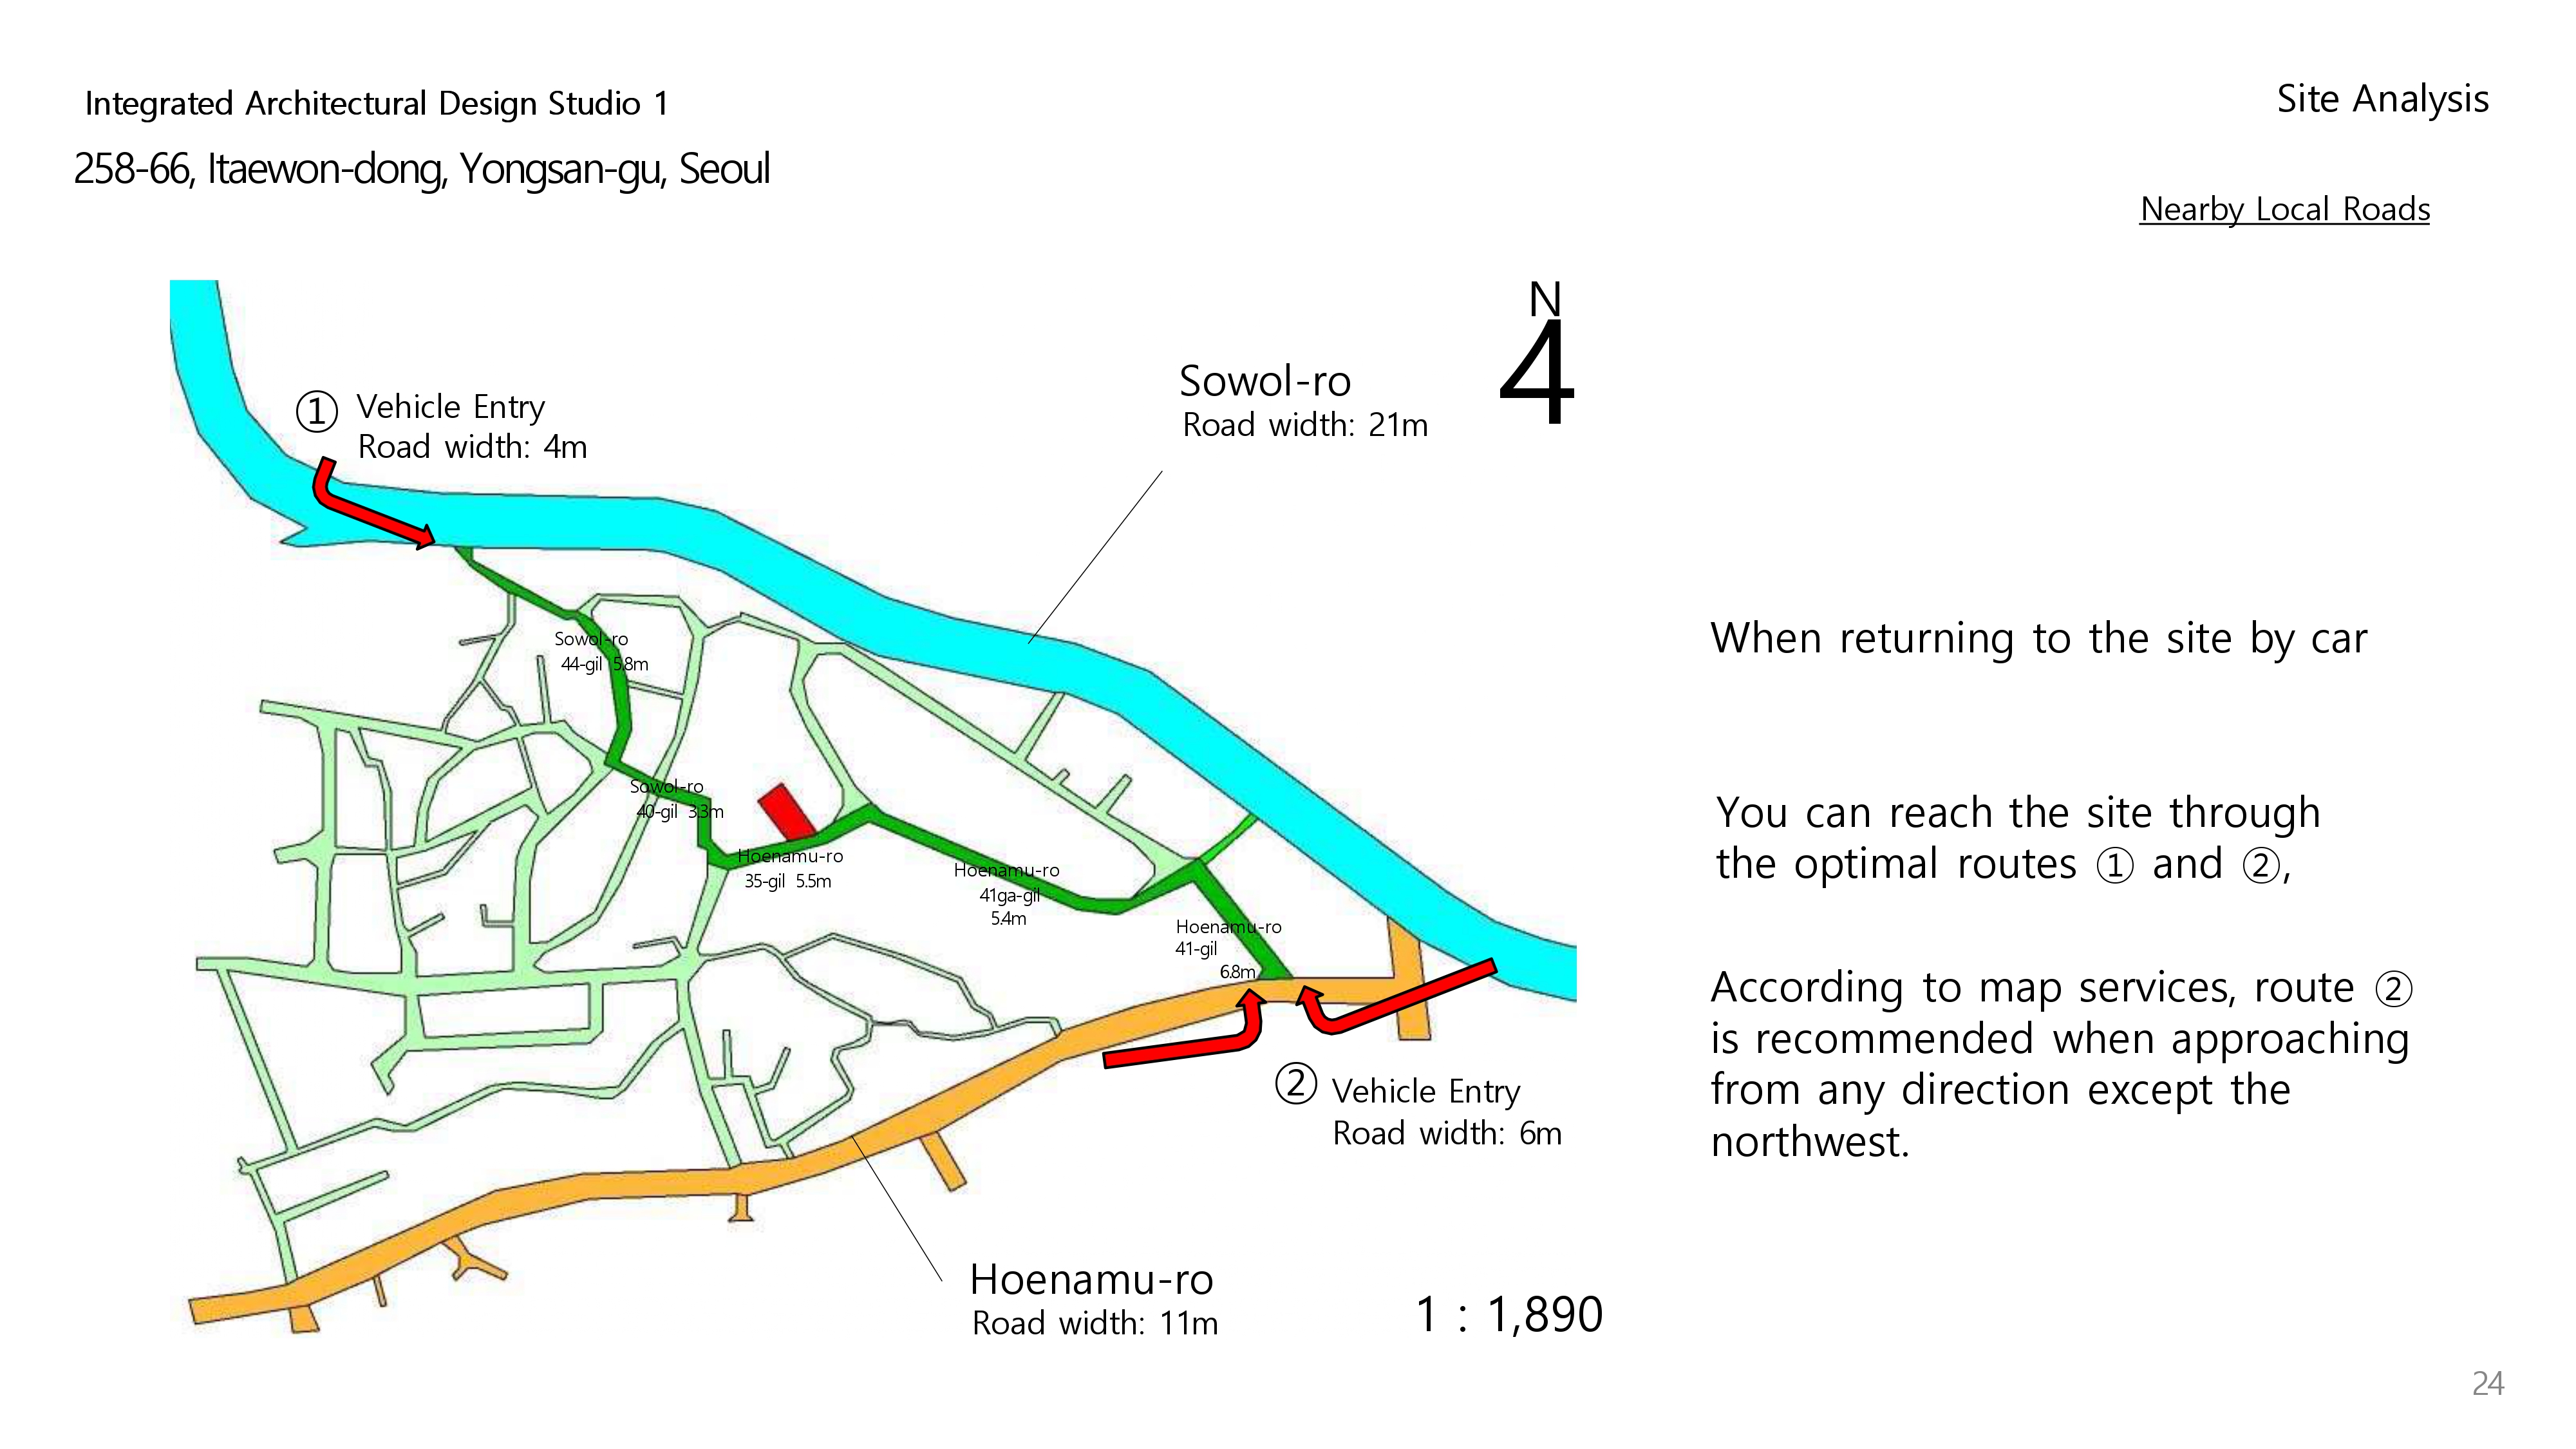
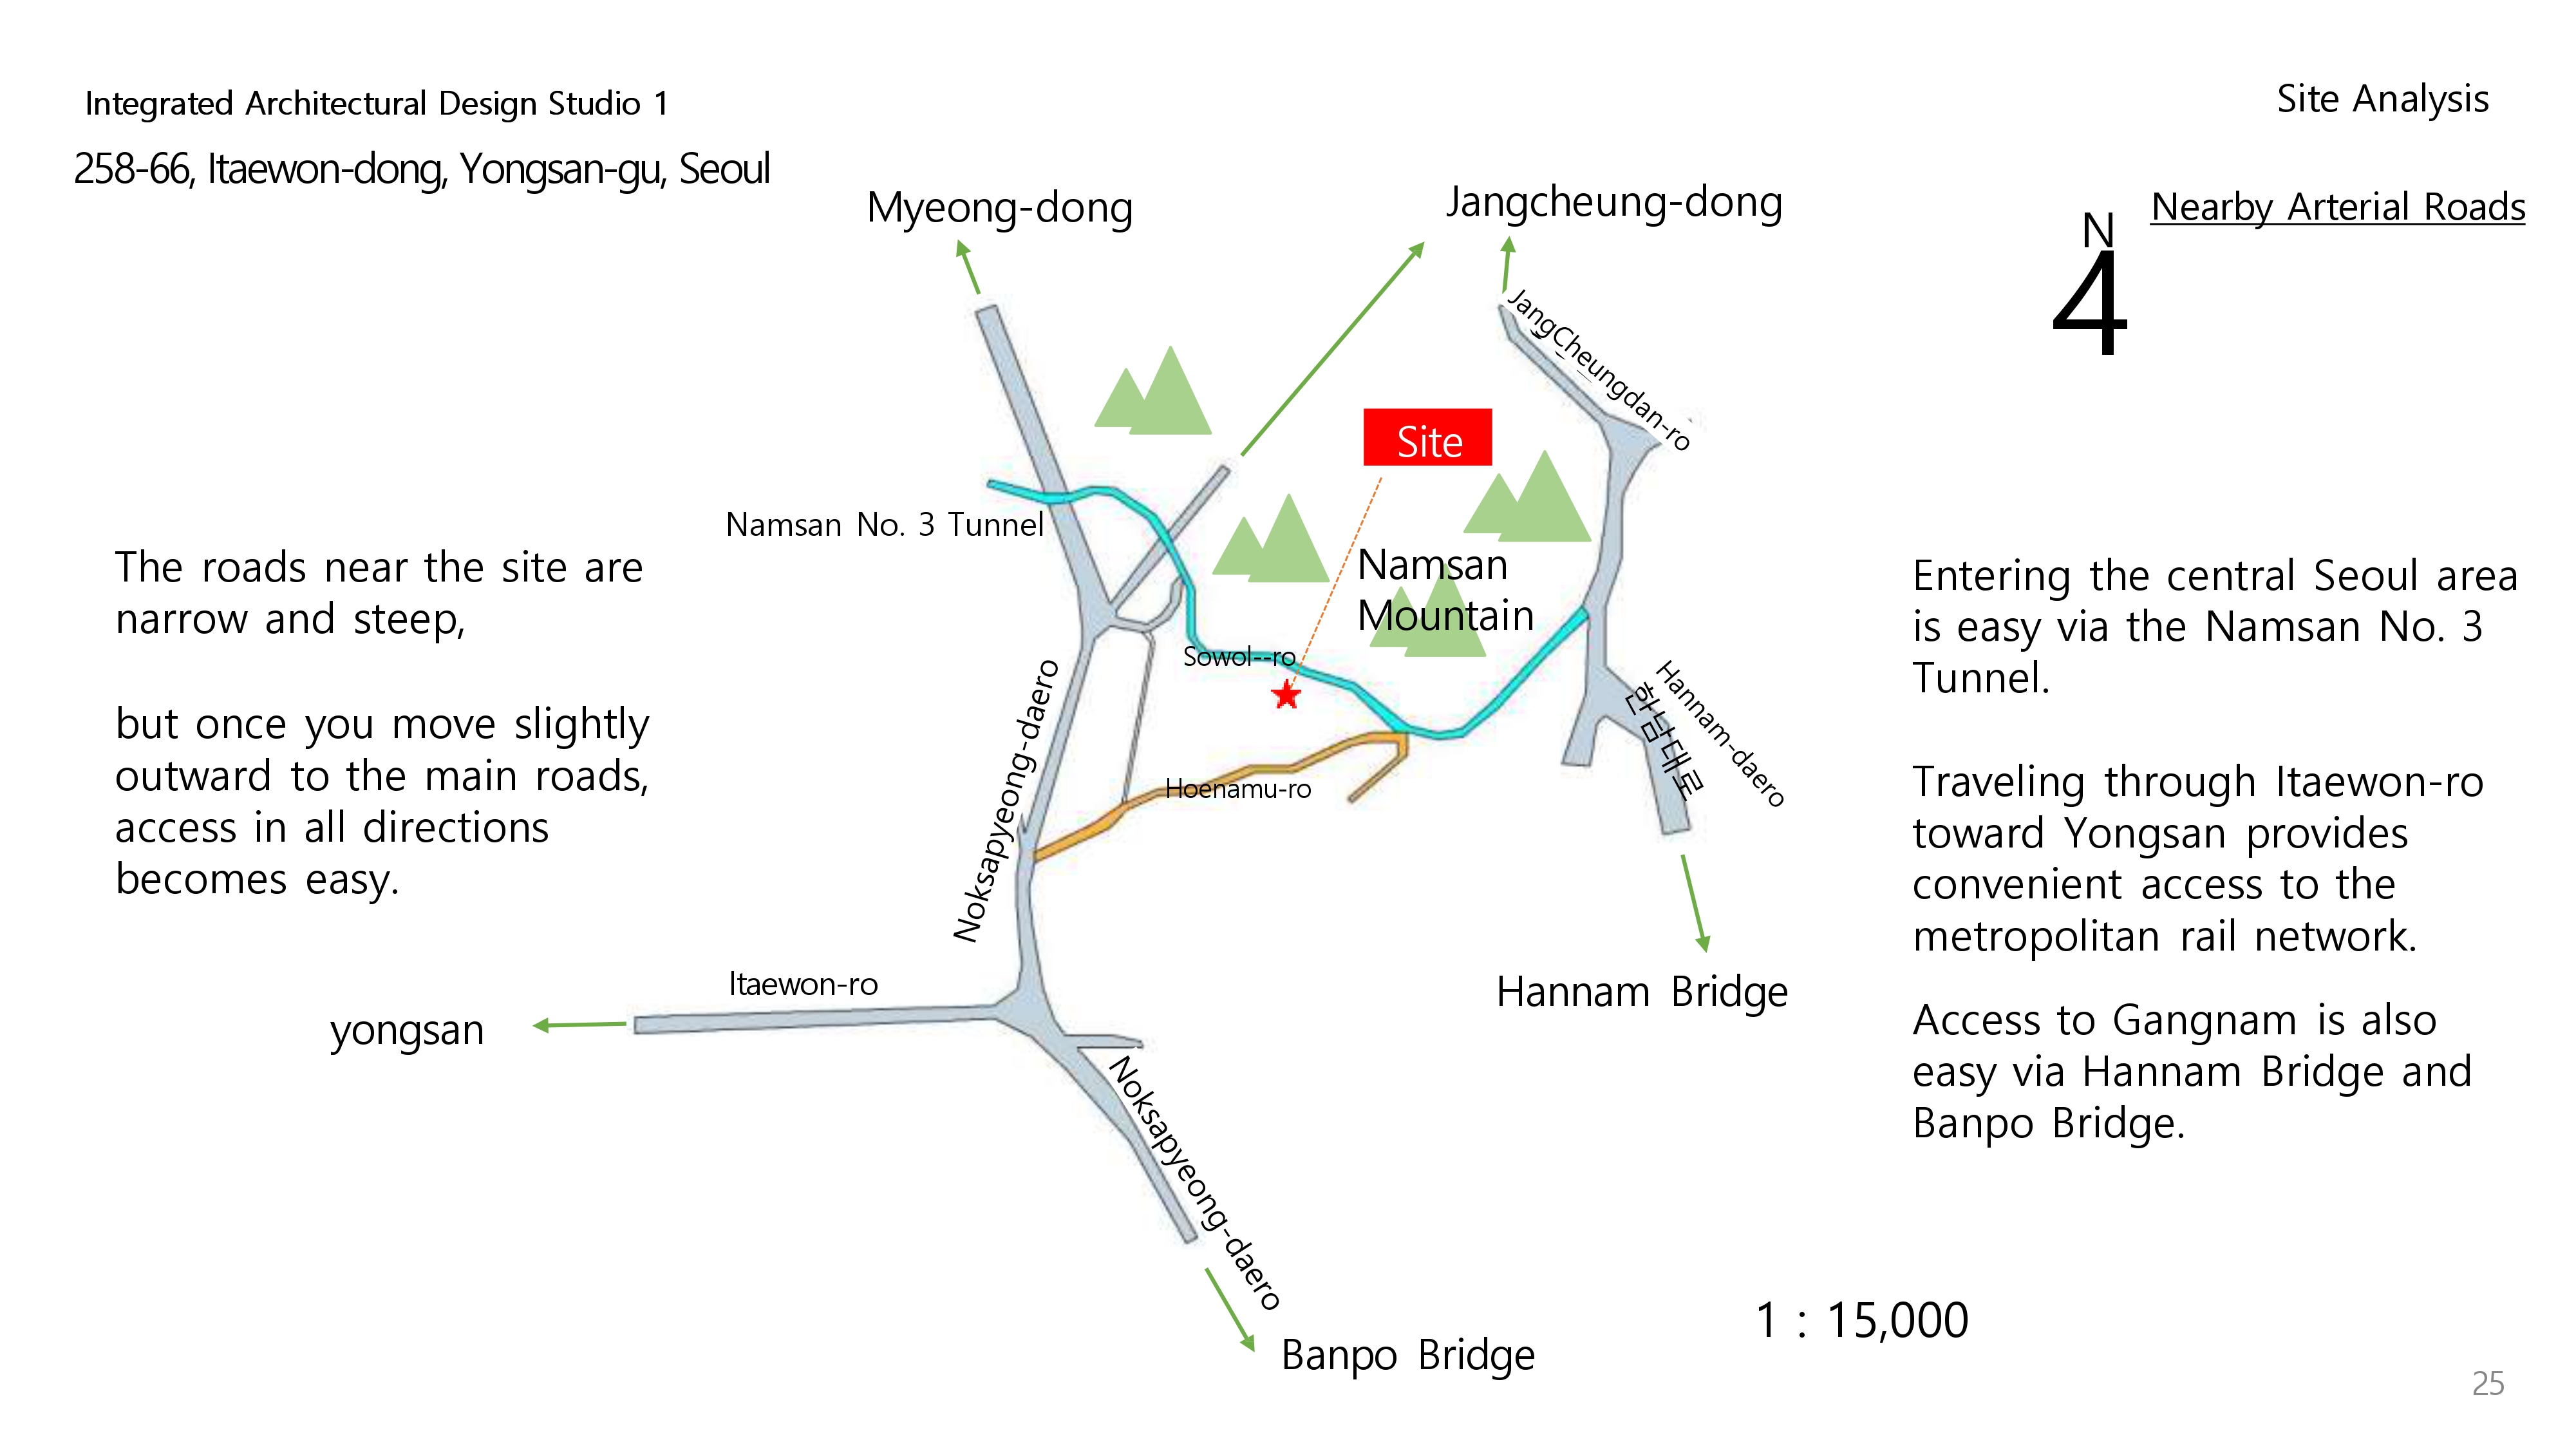
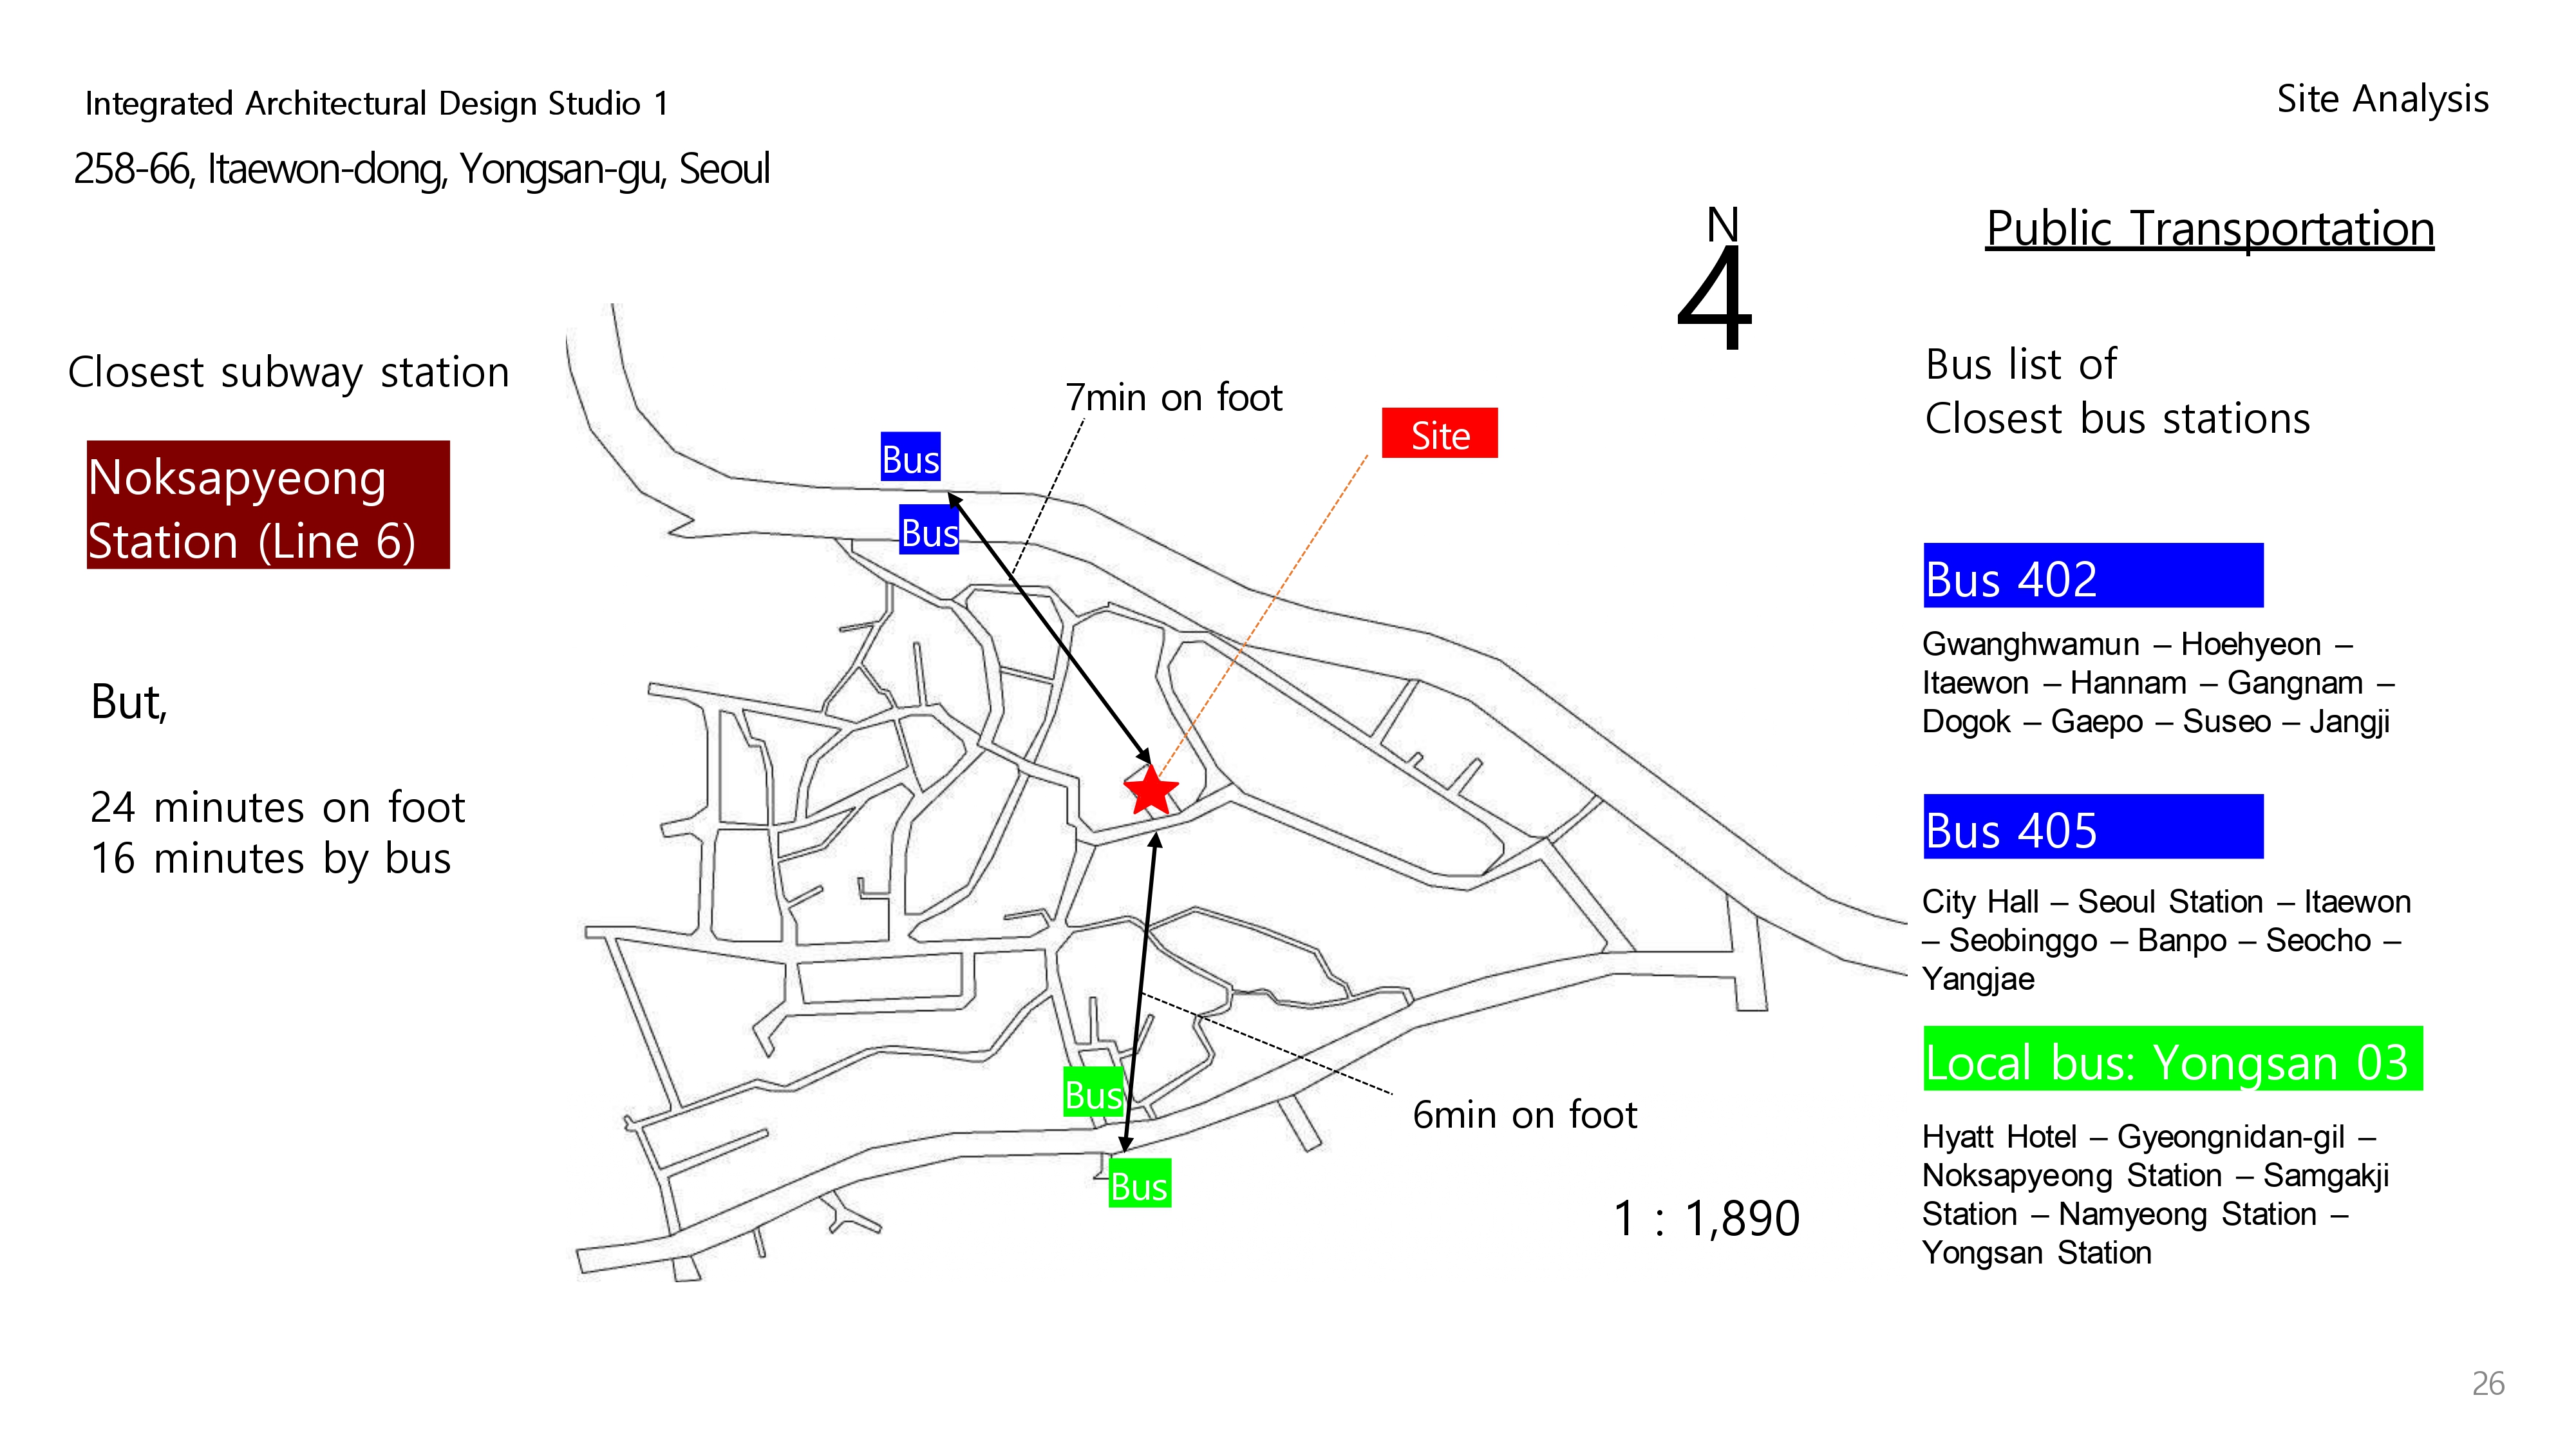
- Accessibility
- Roads & Public Transportation
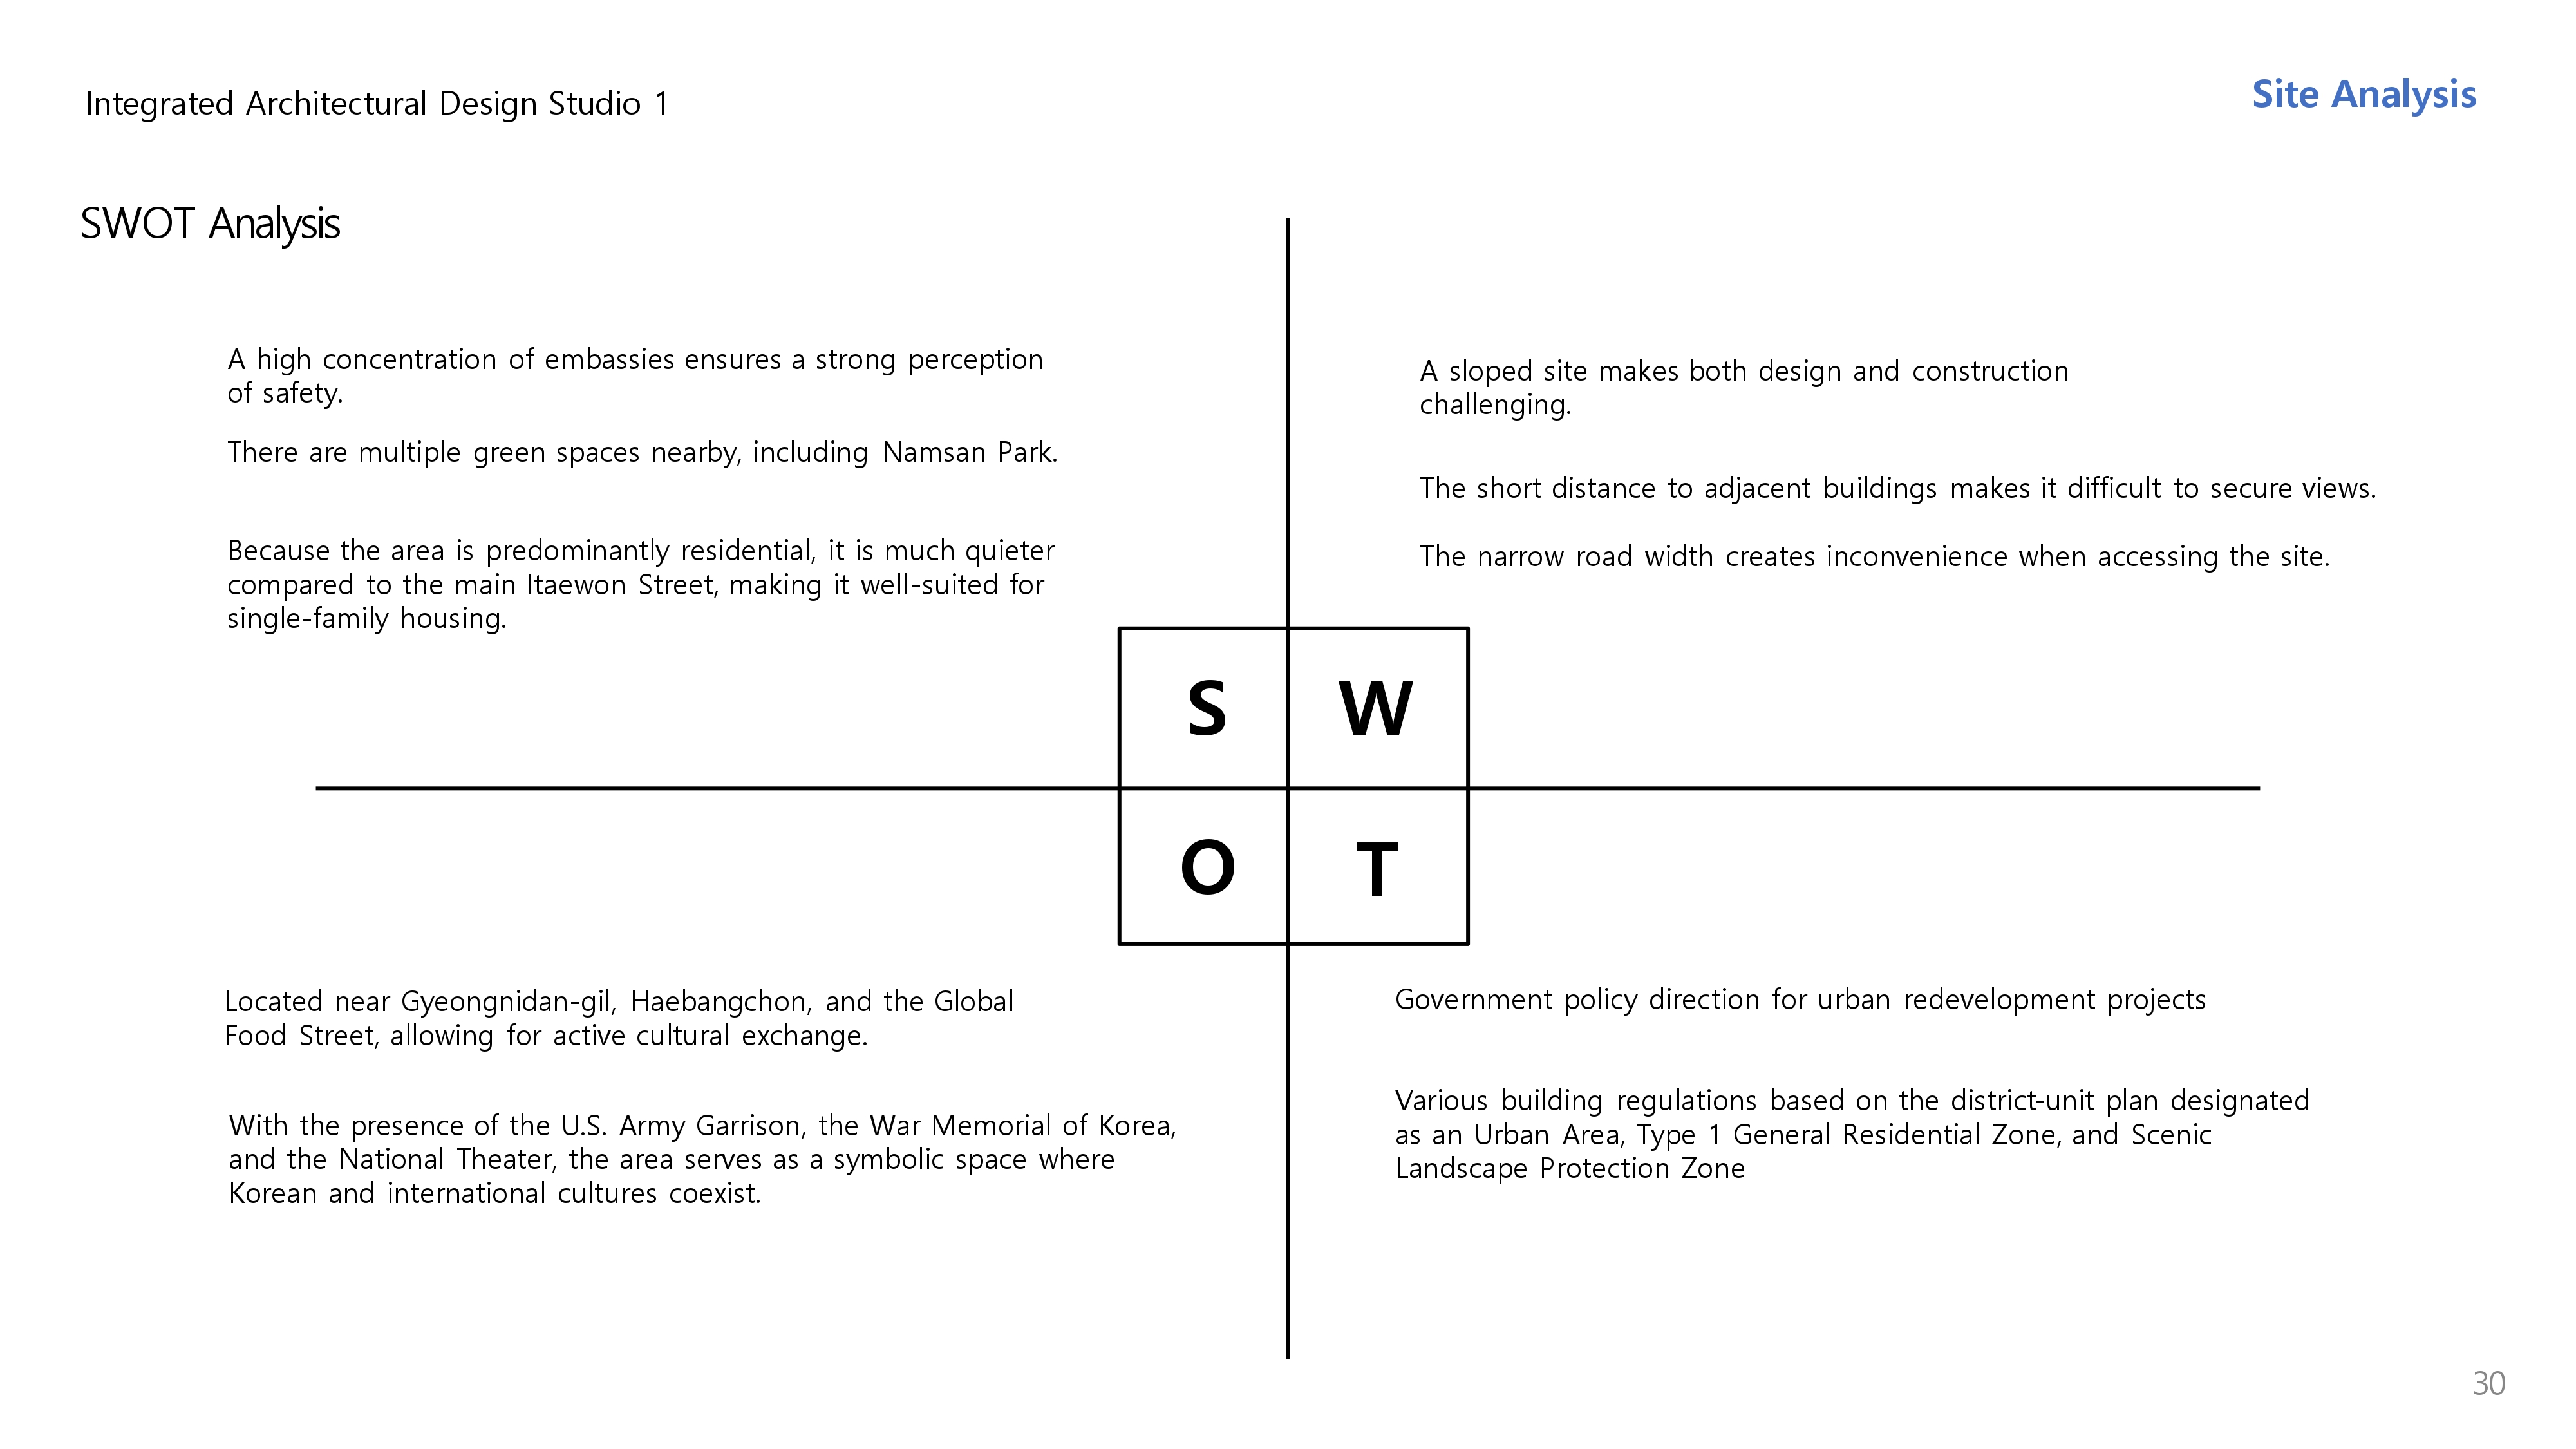
- SWOT Analysis
Full slide elaborating on the site analysis:


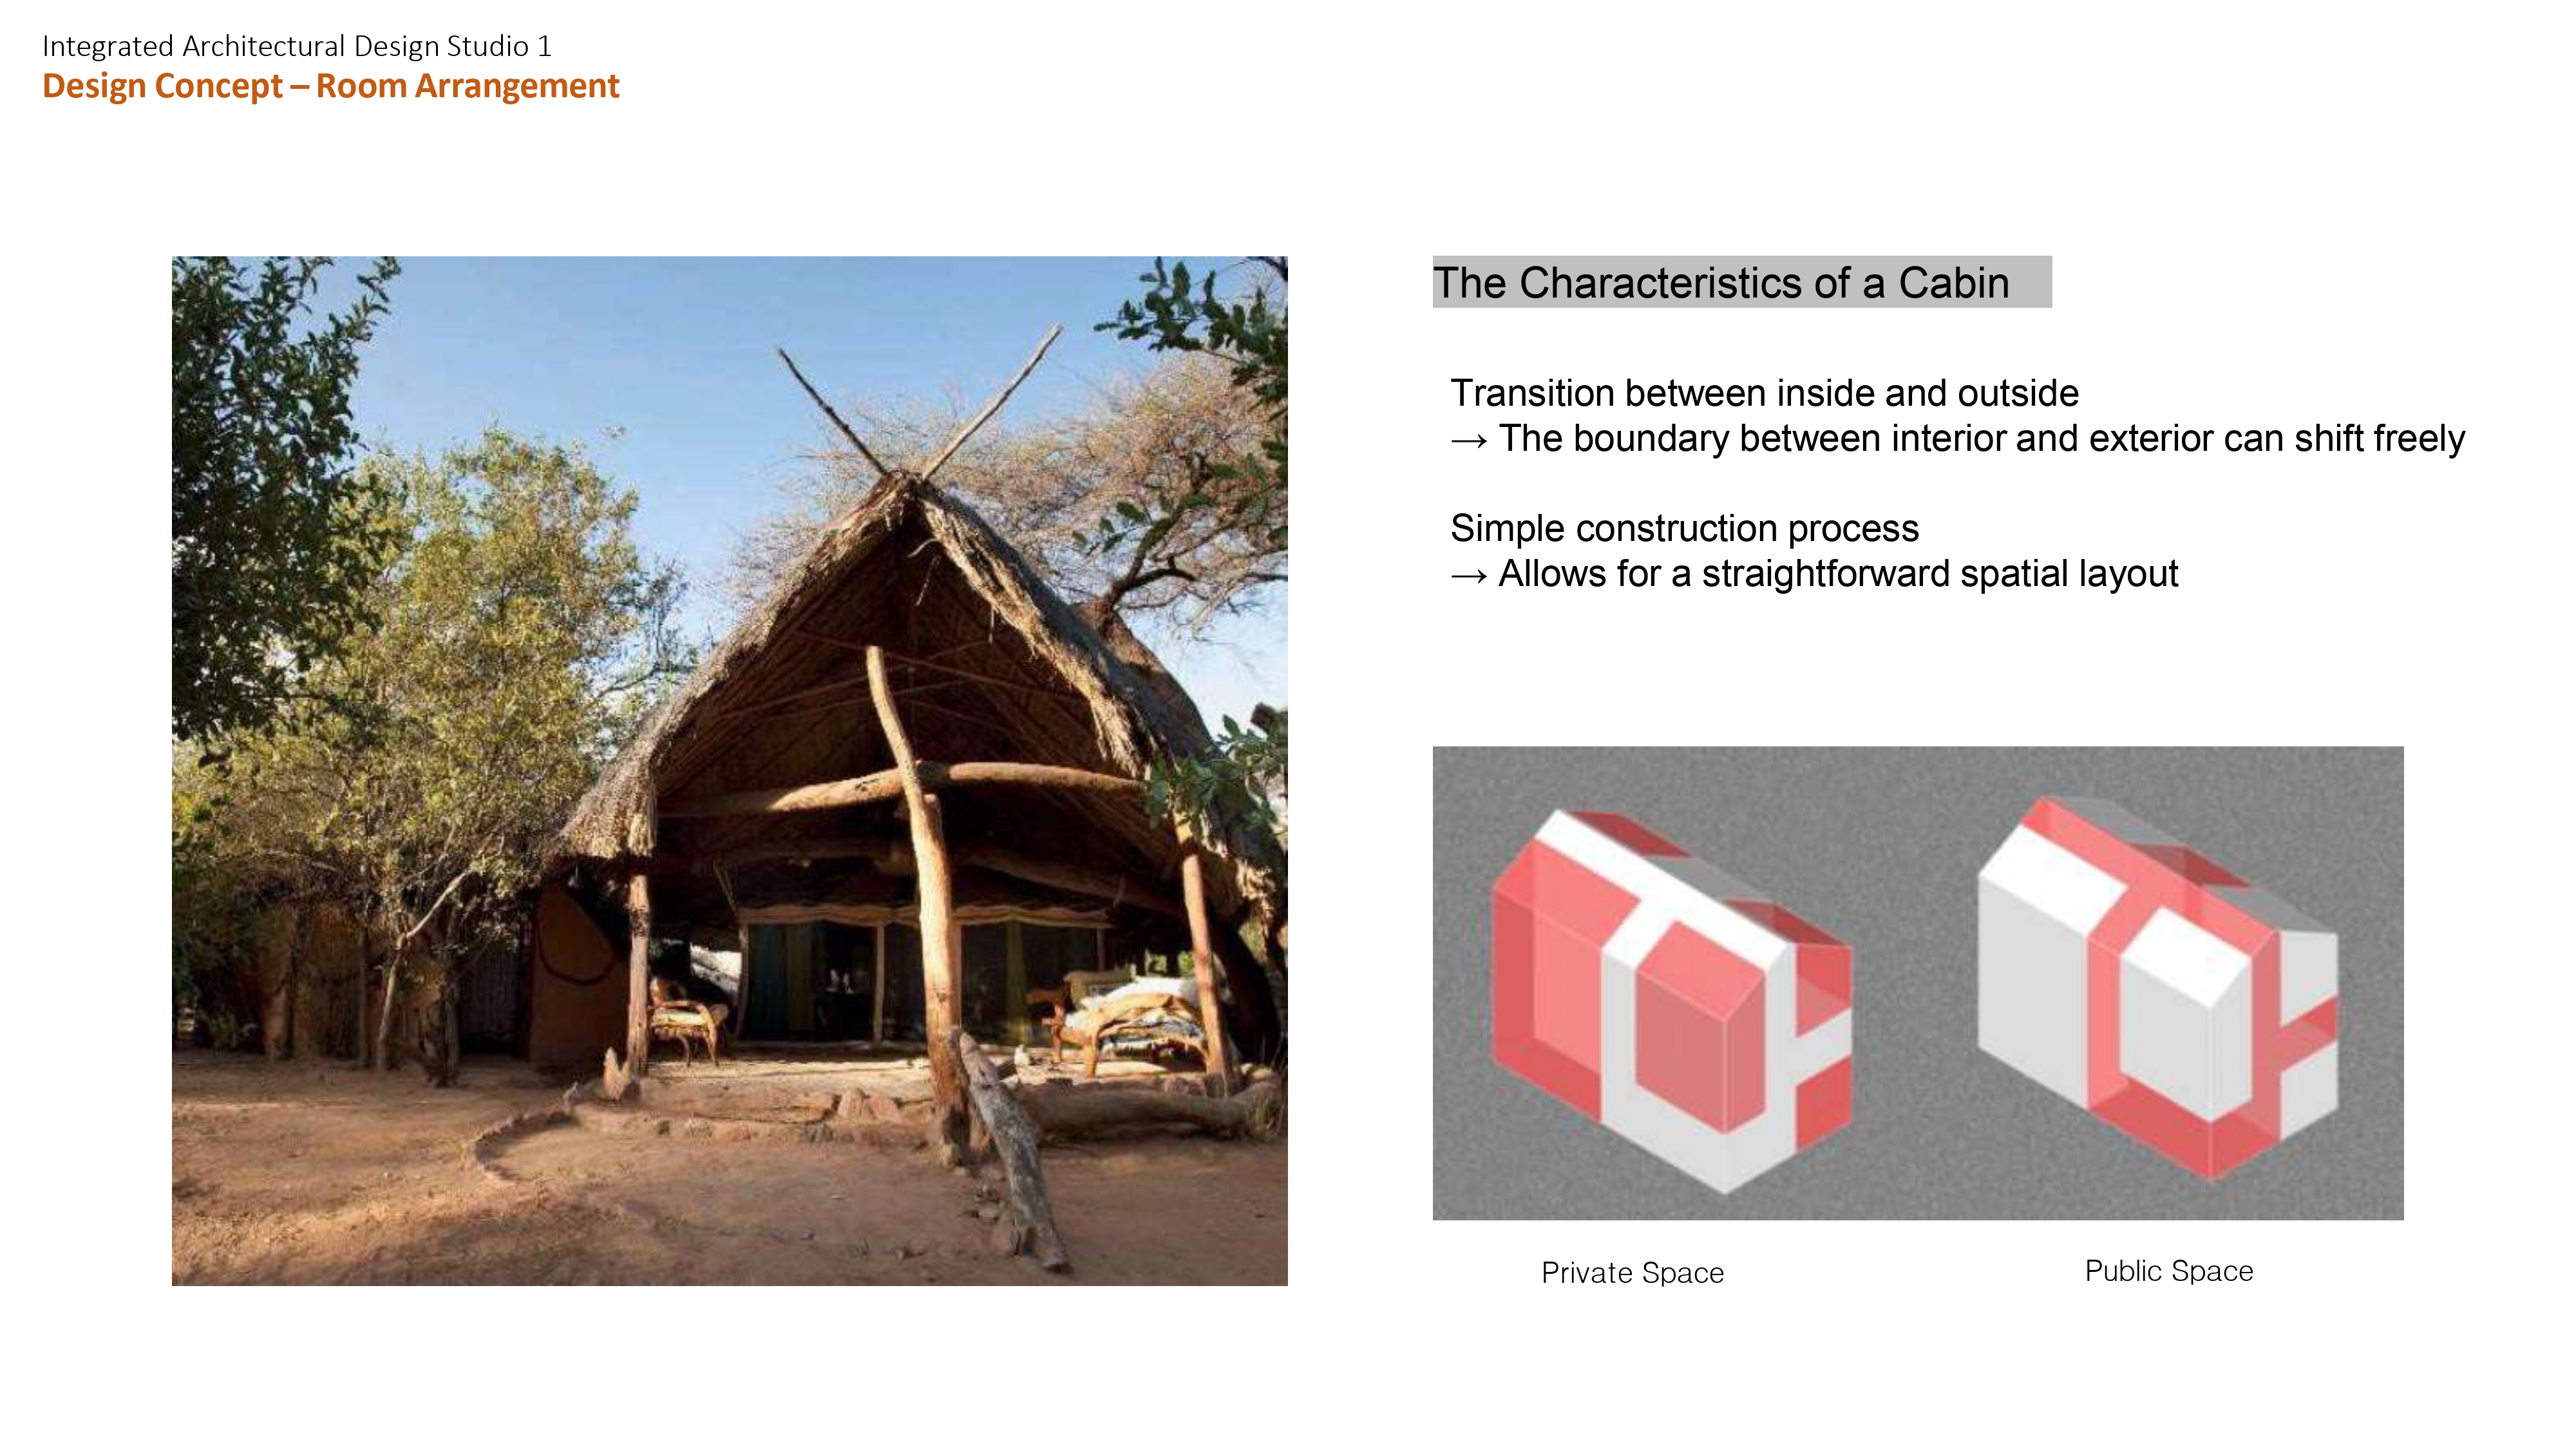
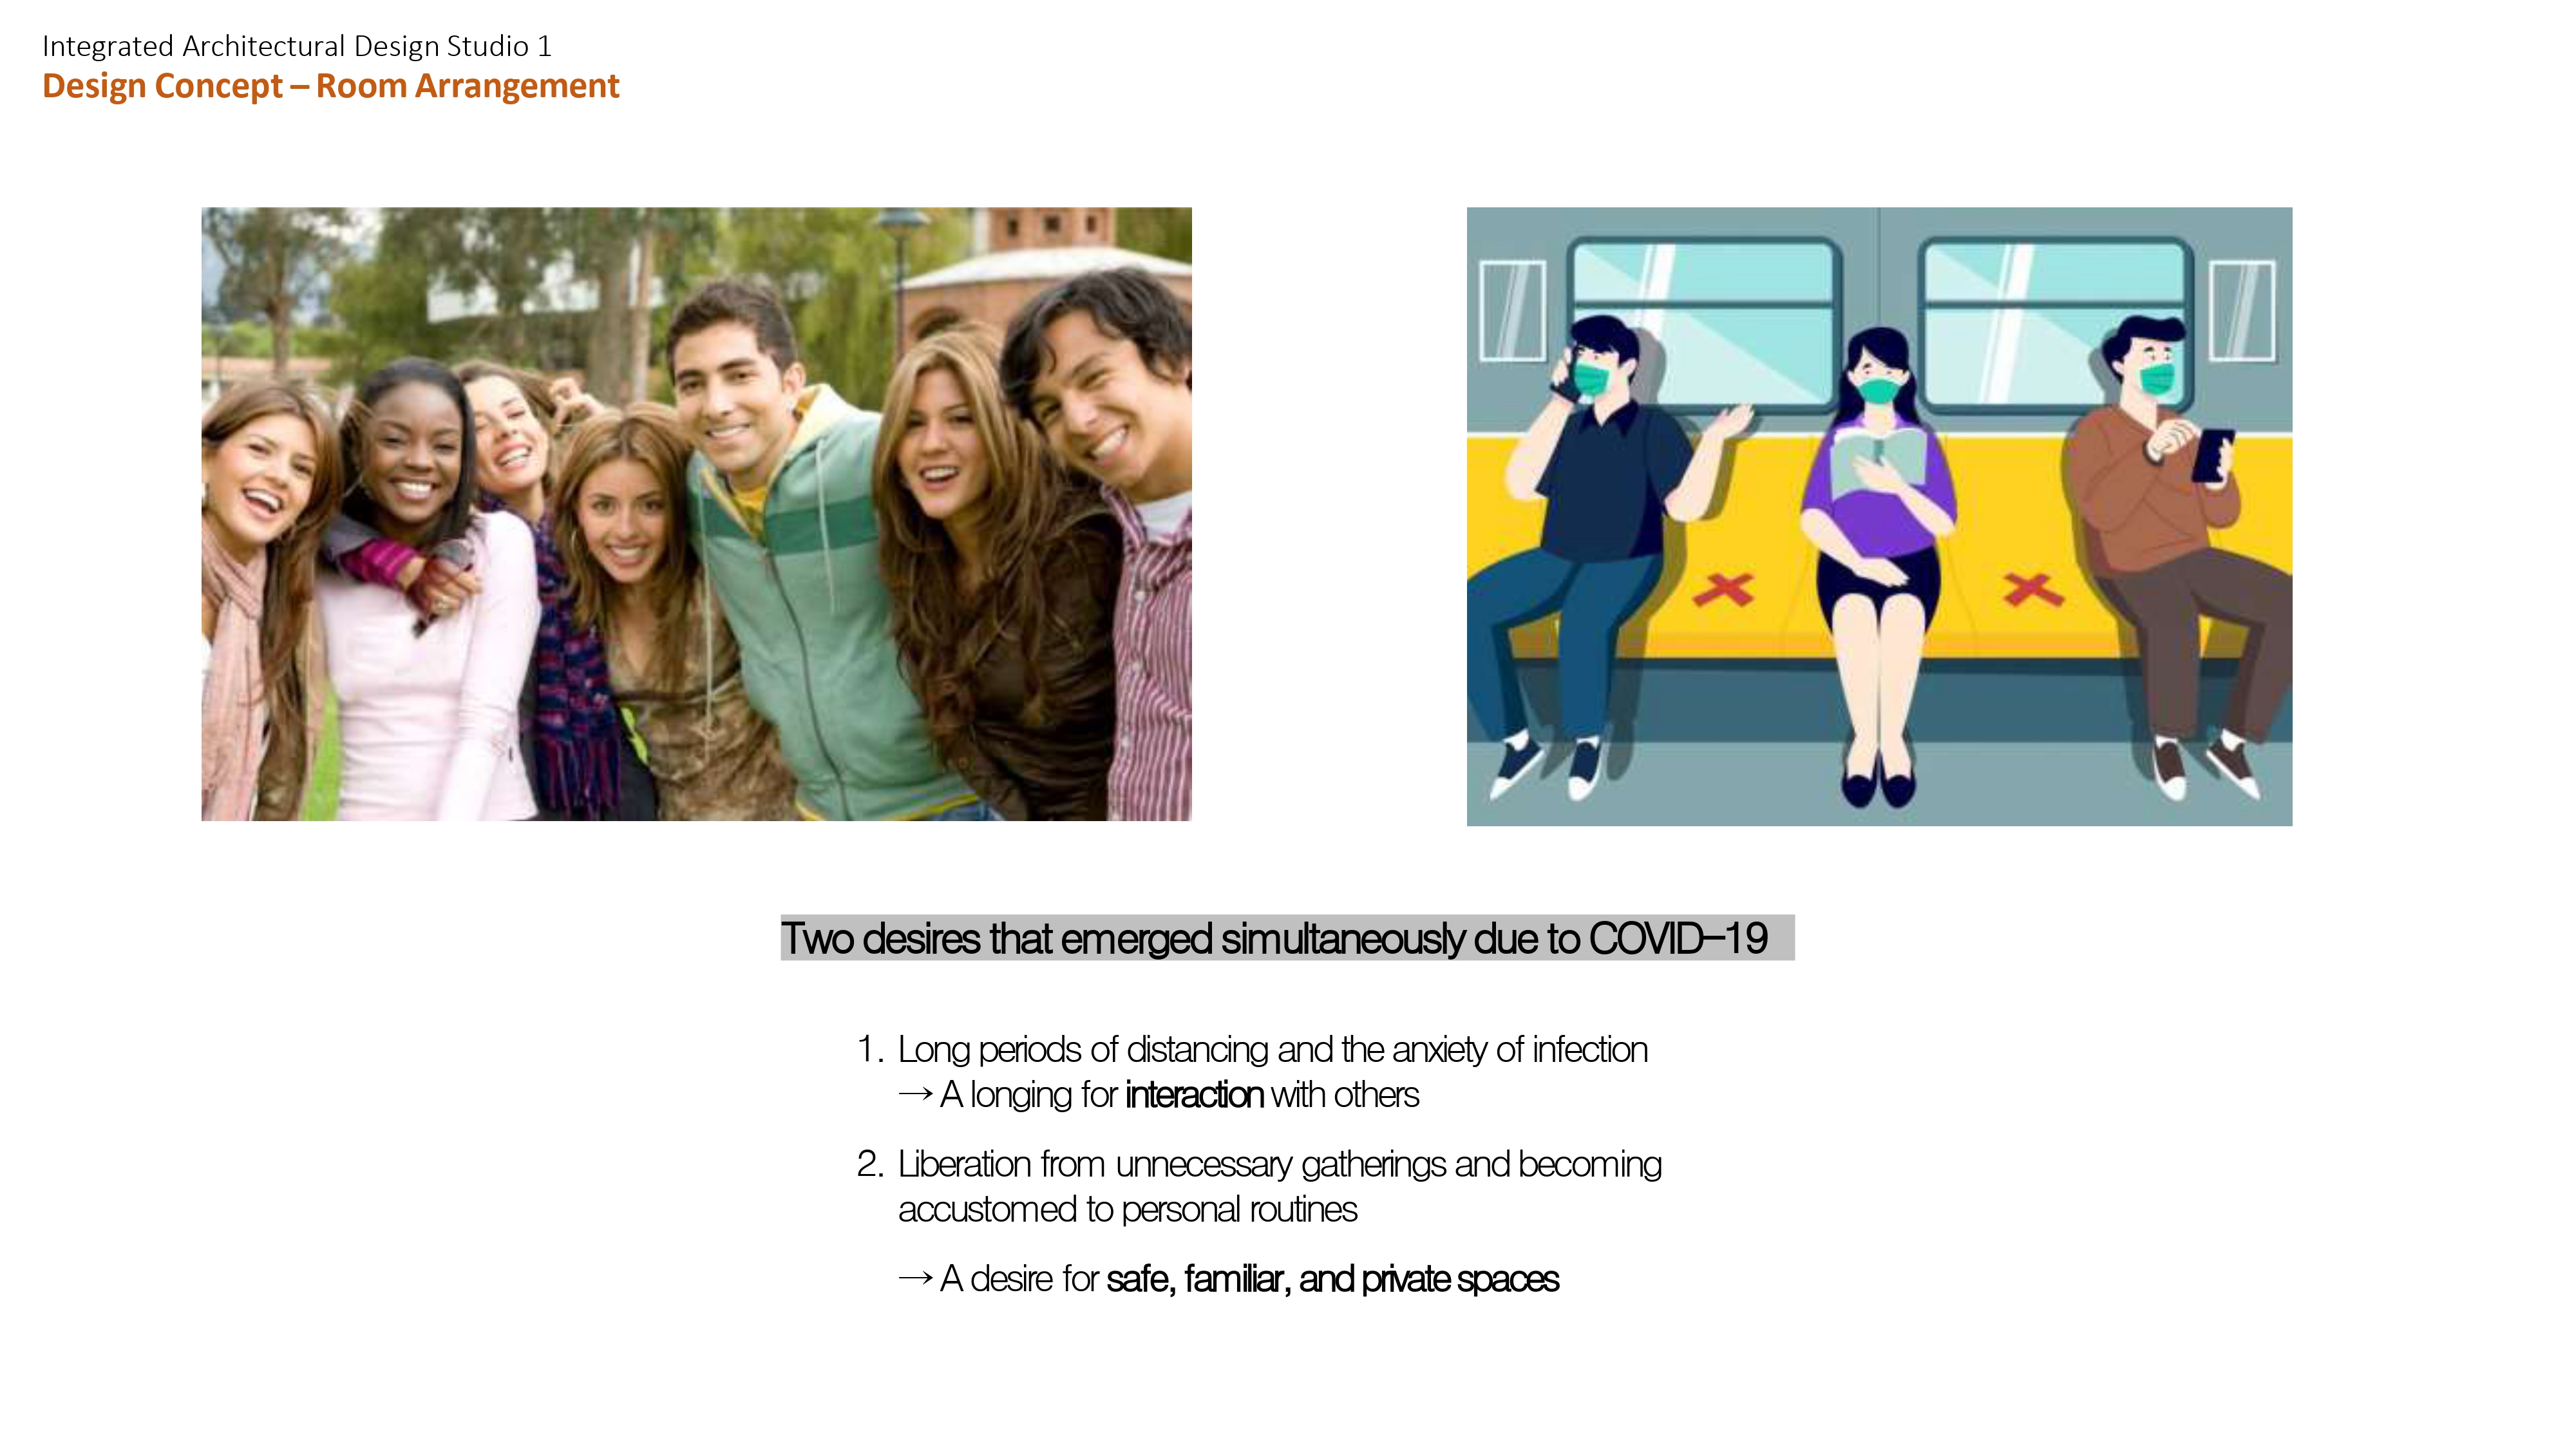
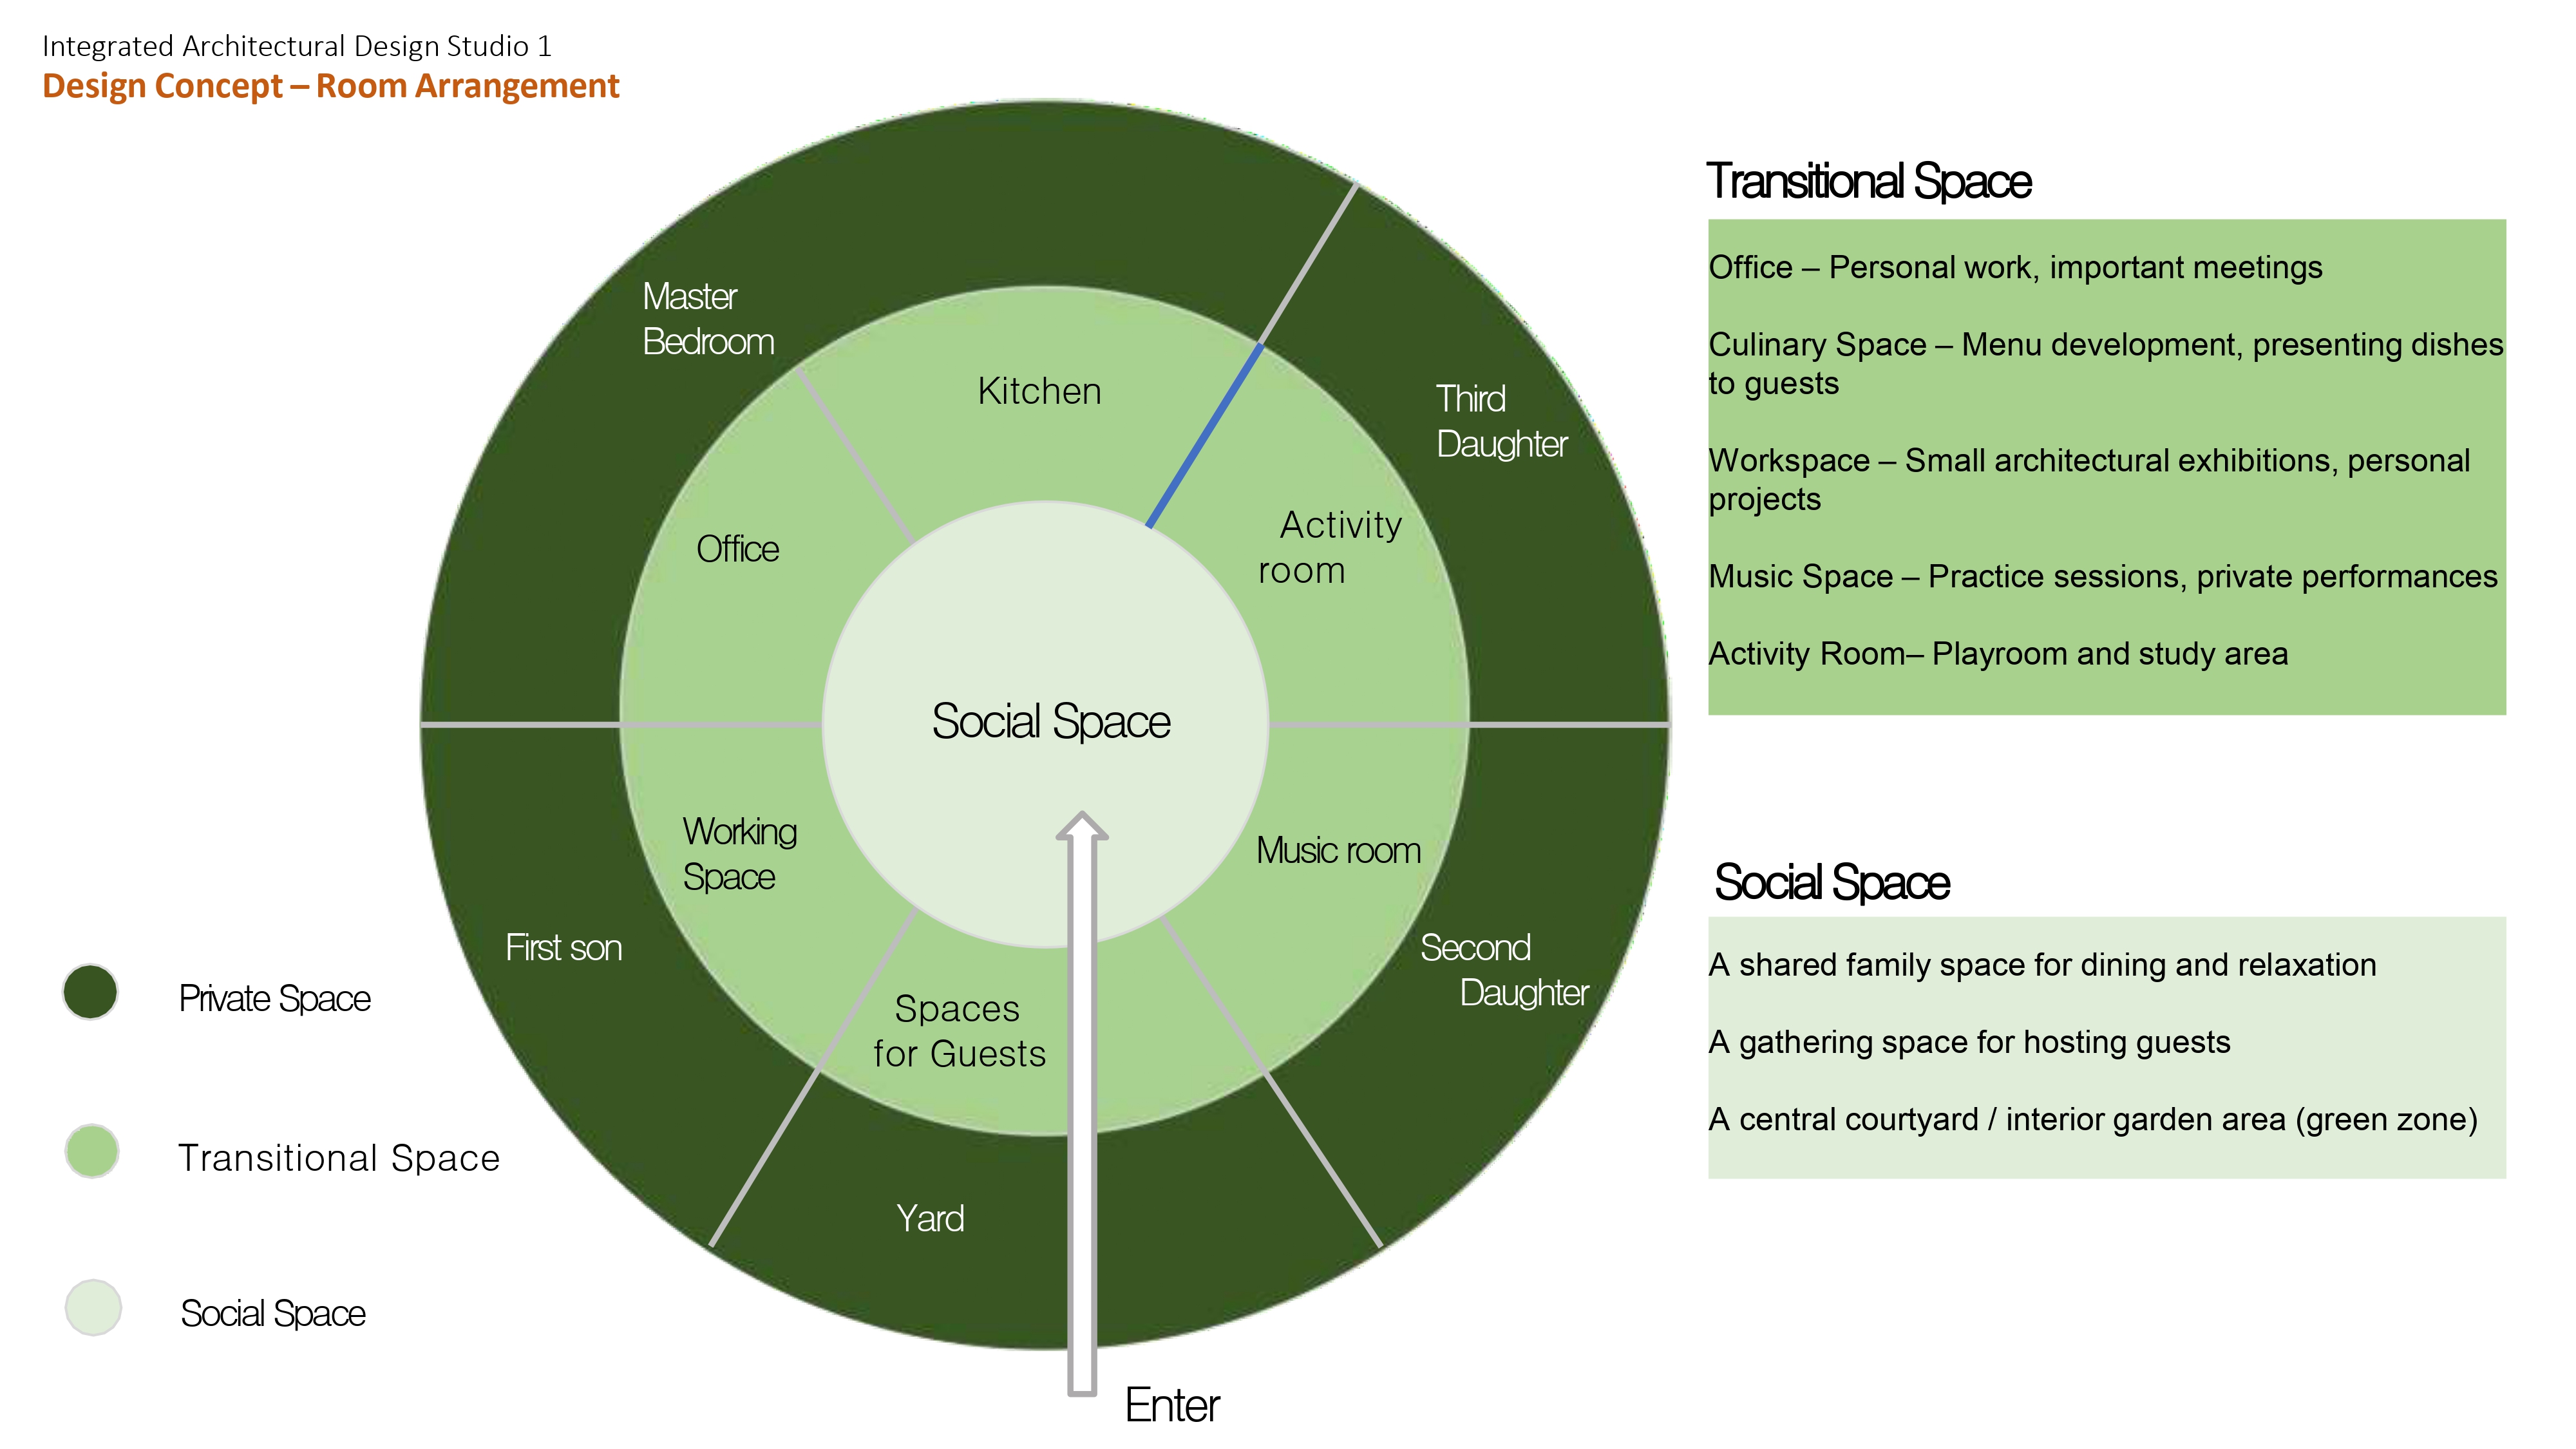
② Design Concept
The design concept is grounded in the diverse lifestyles of the five residents and the way their daily routines inform spatial needs and shared interactions. It is organized into two key components:
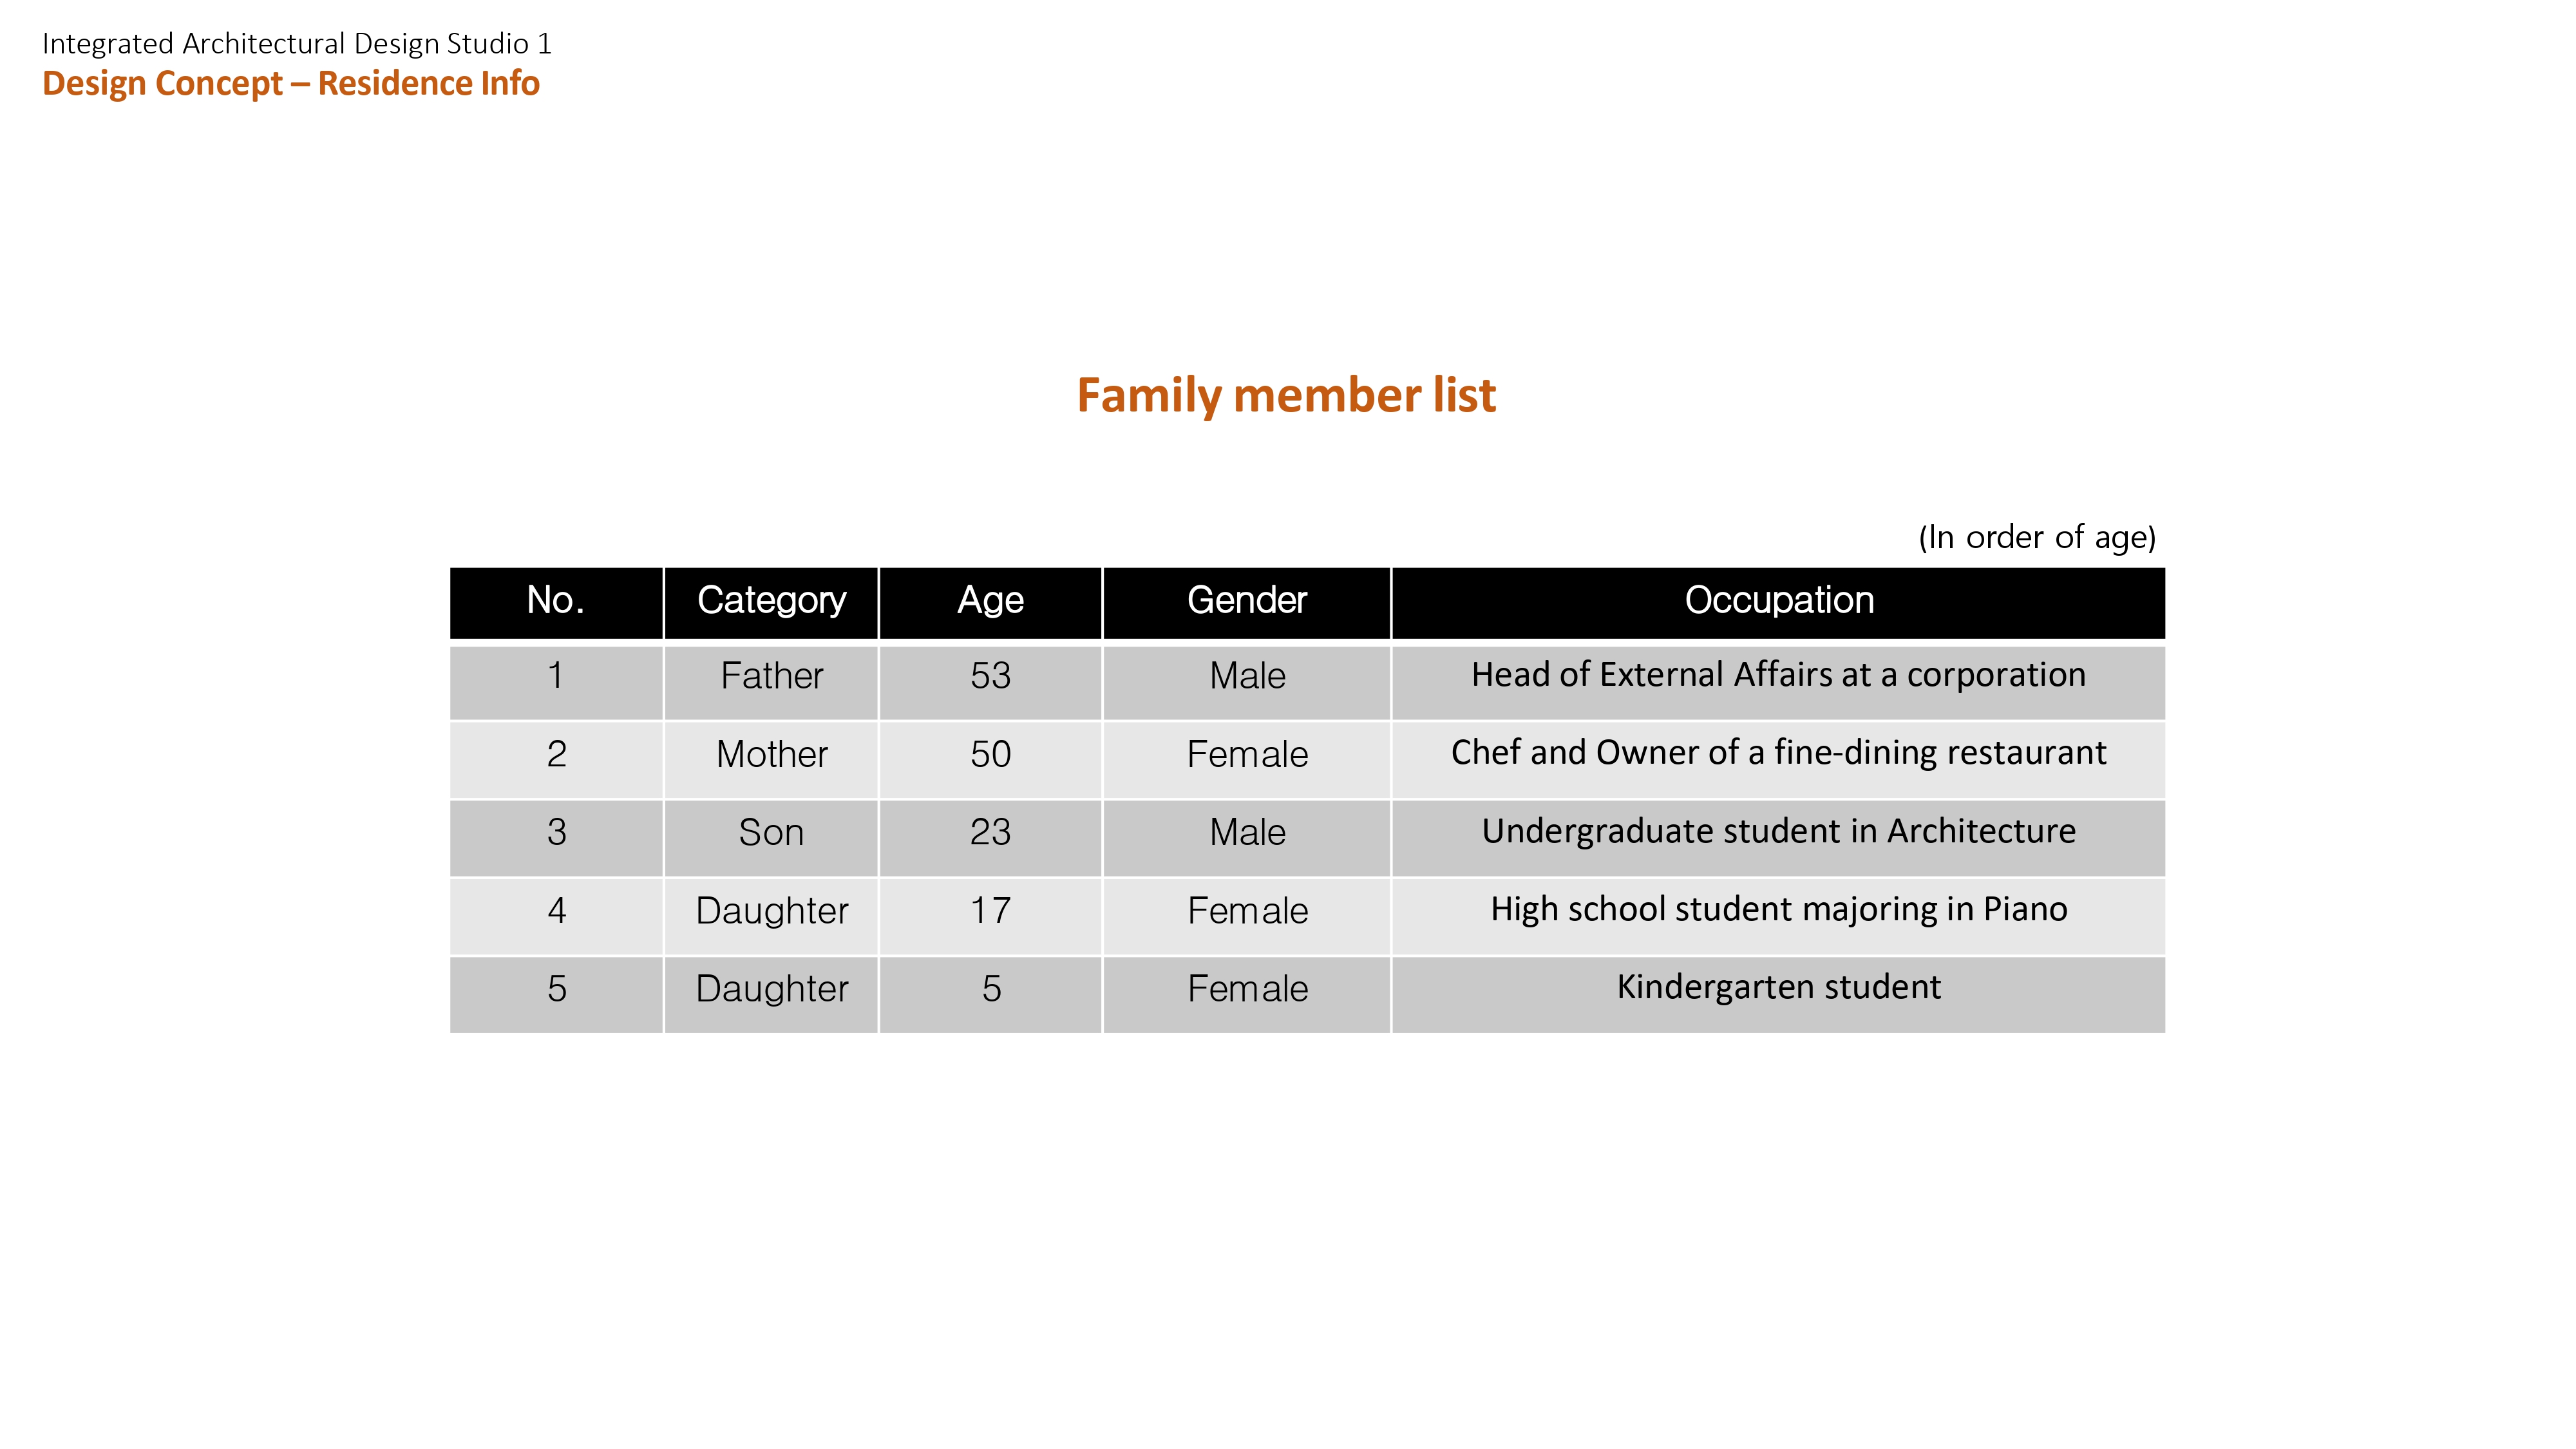
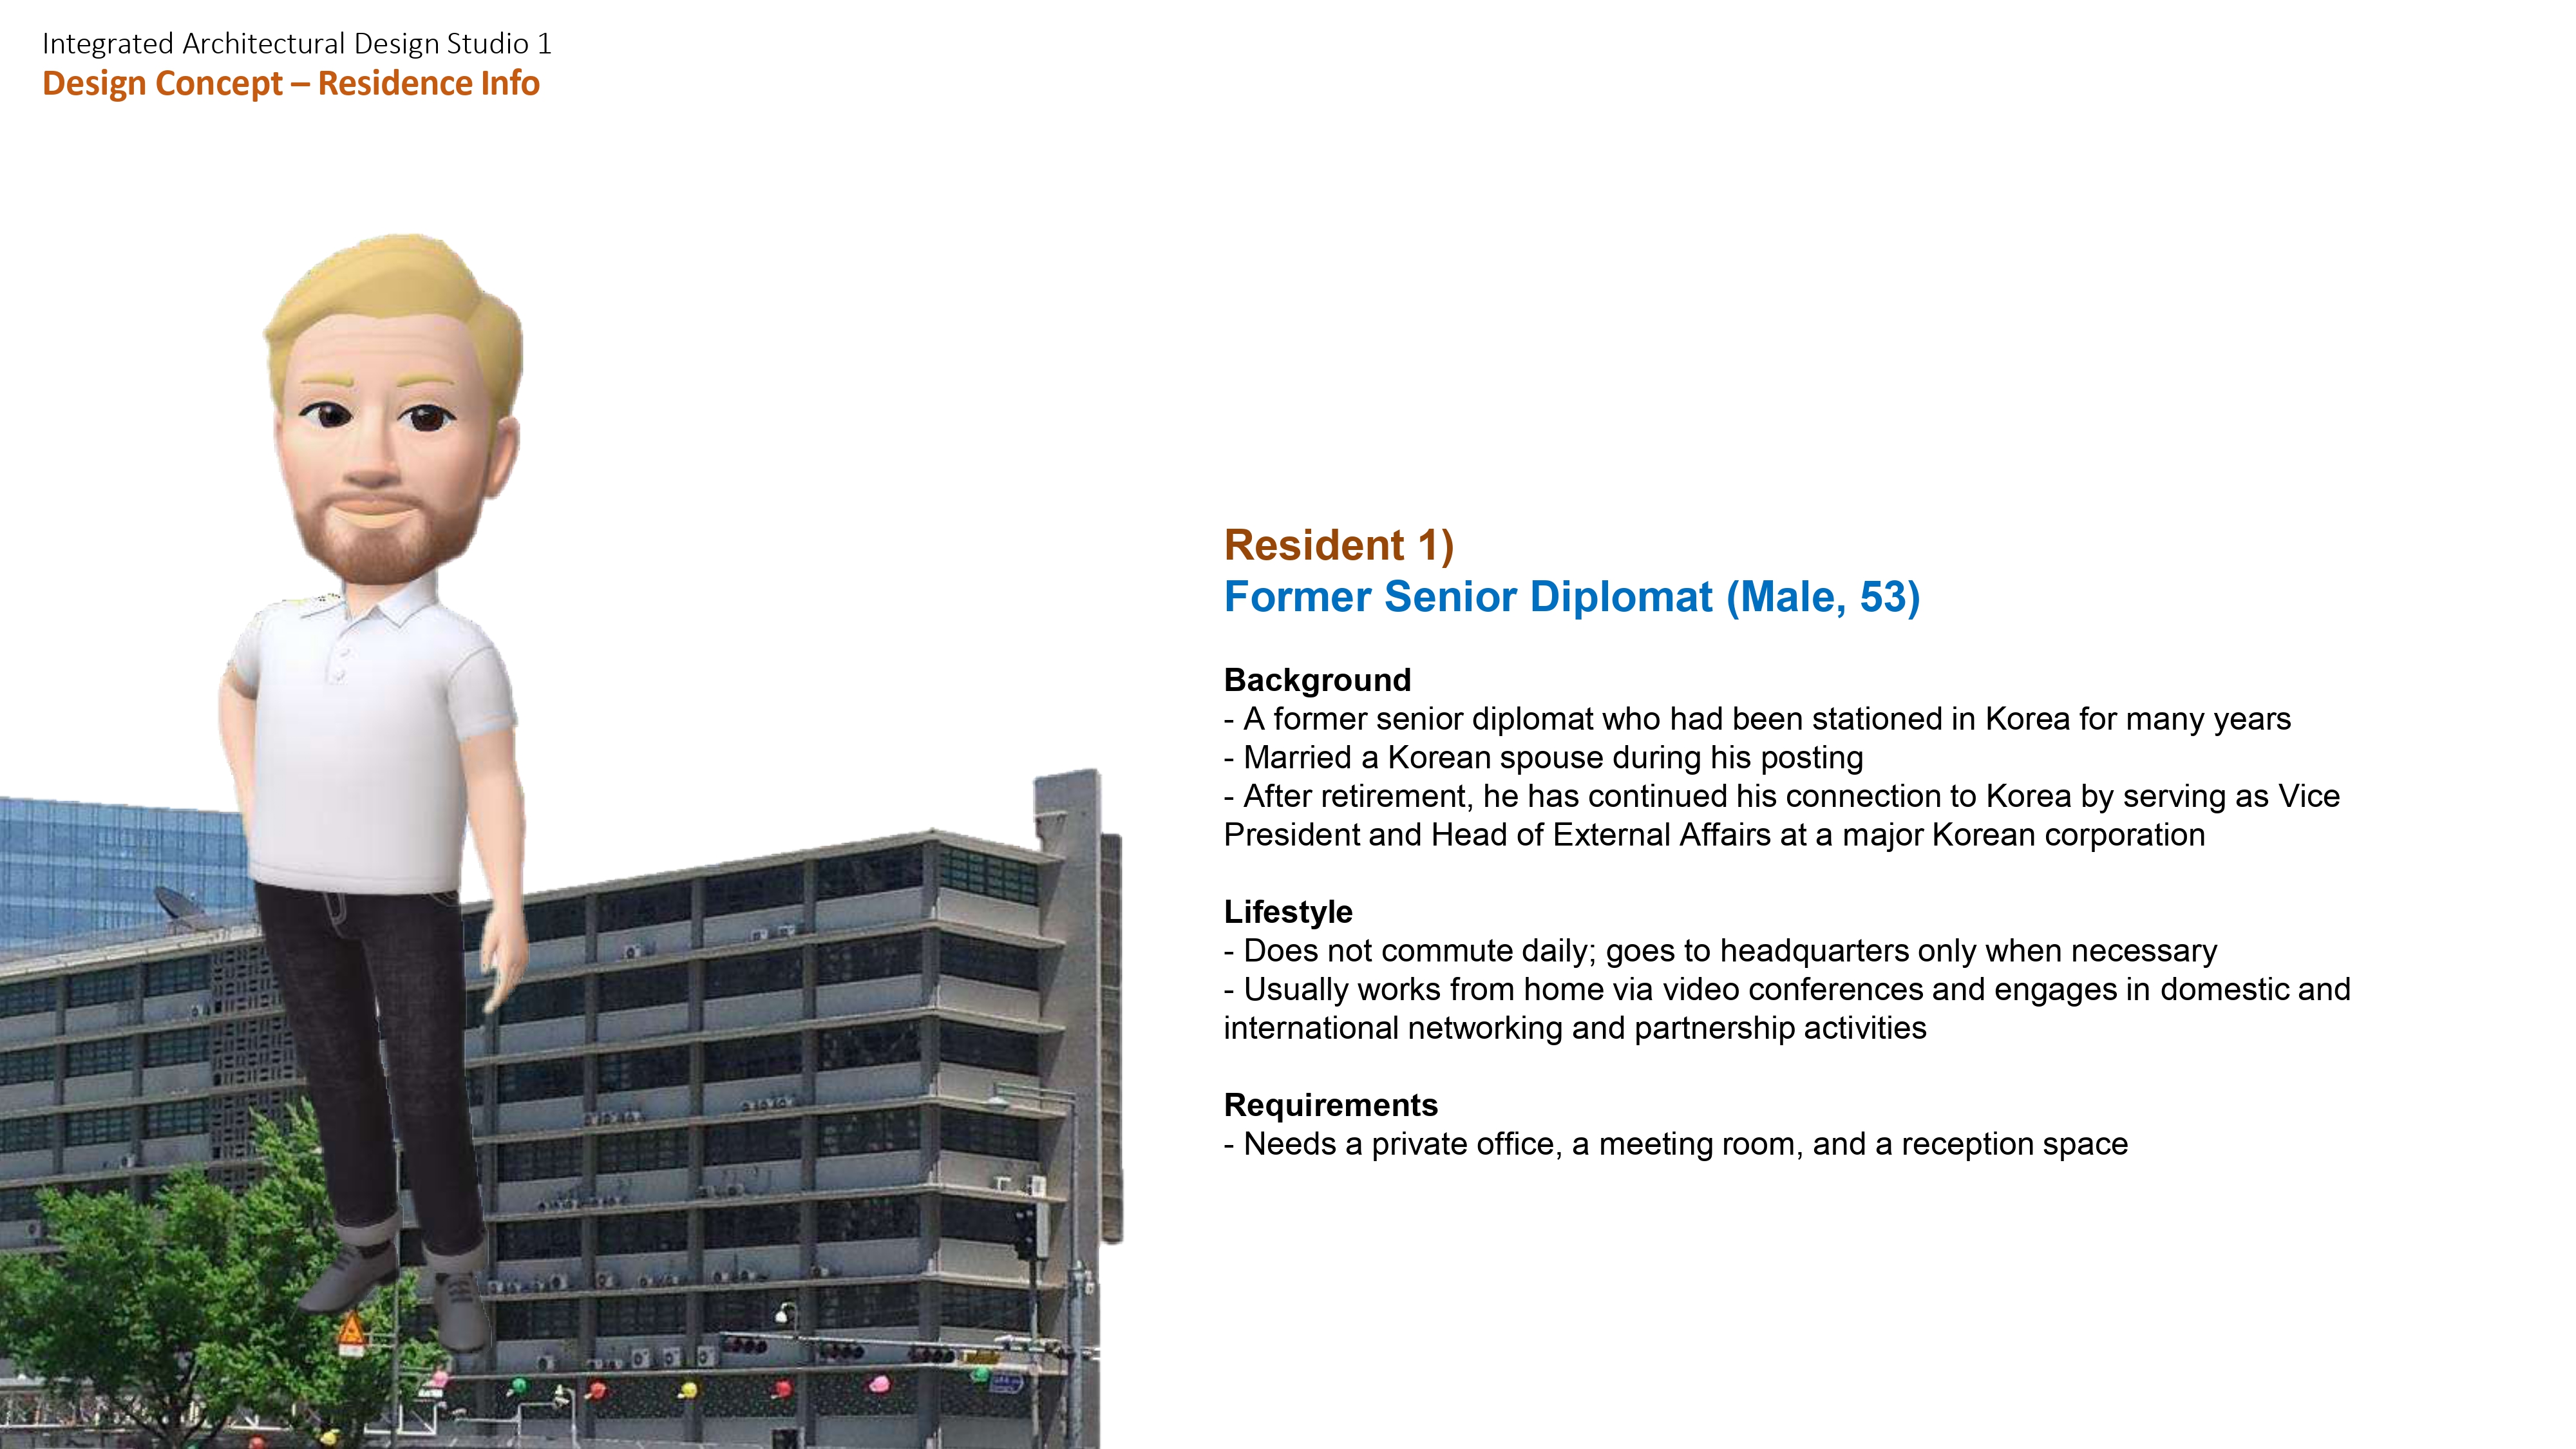
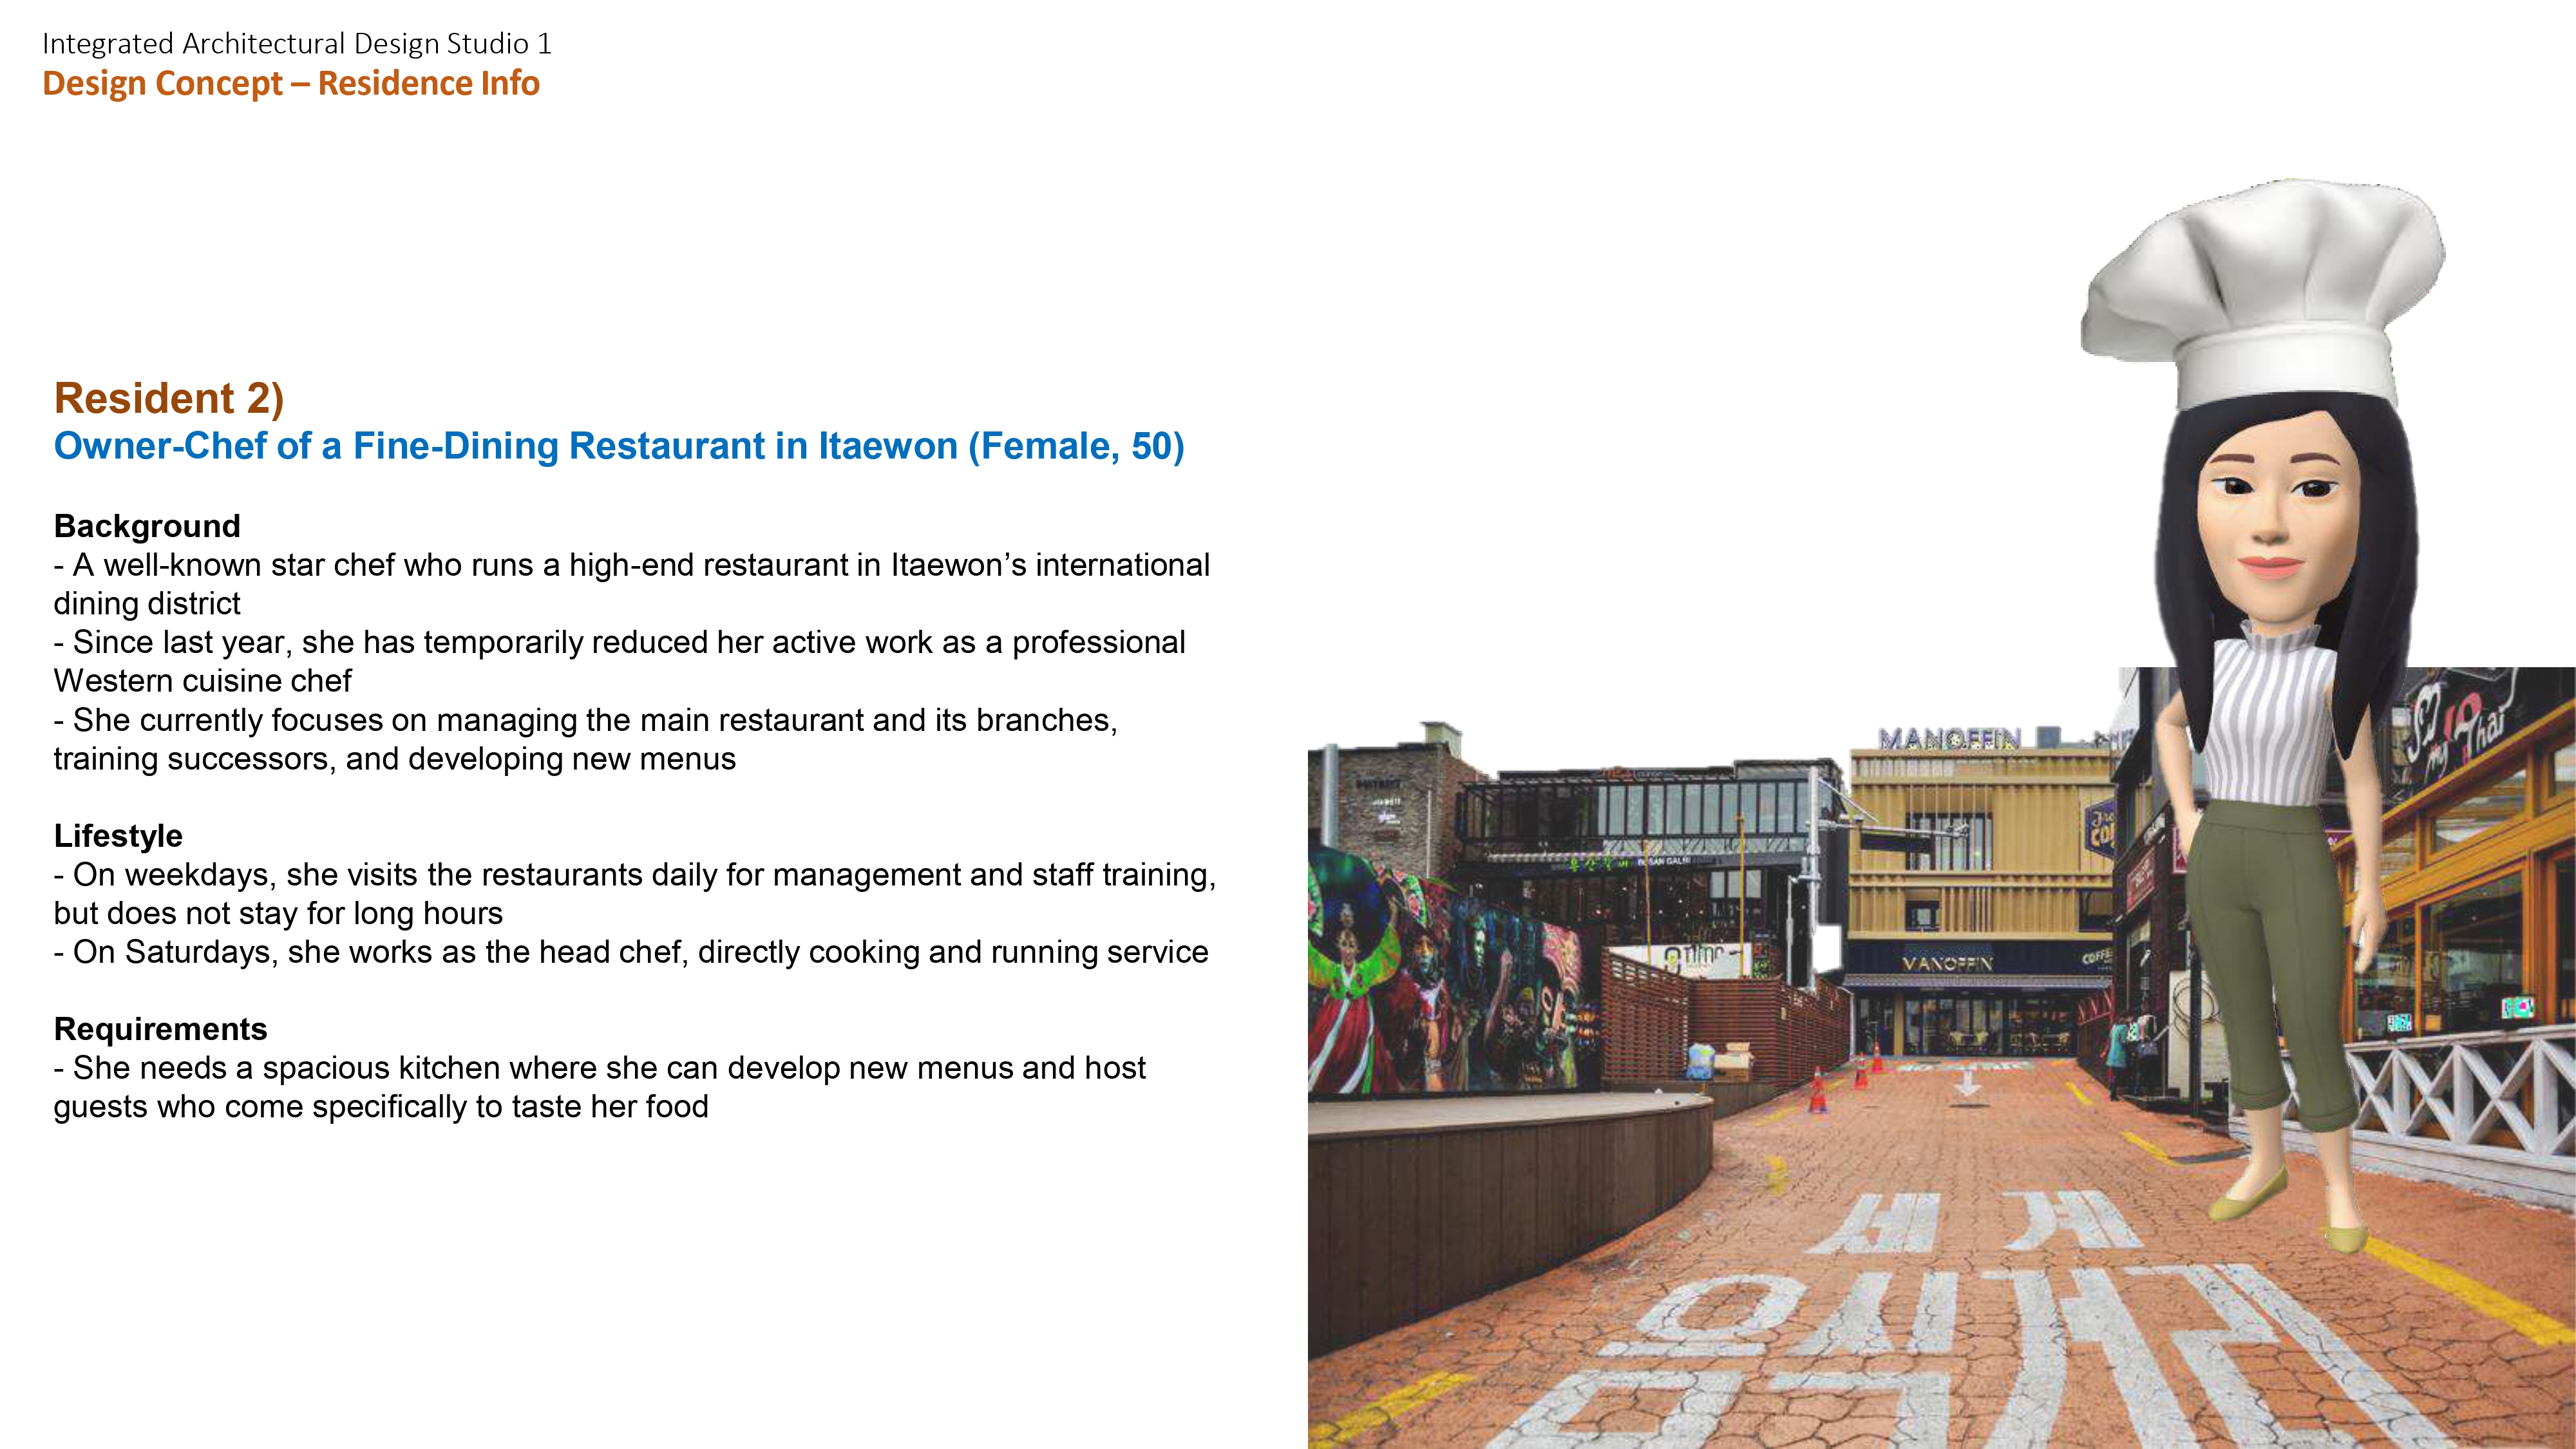
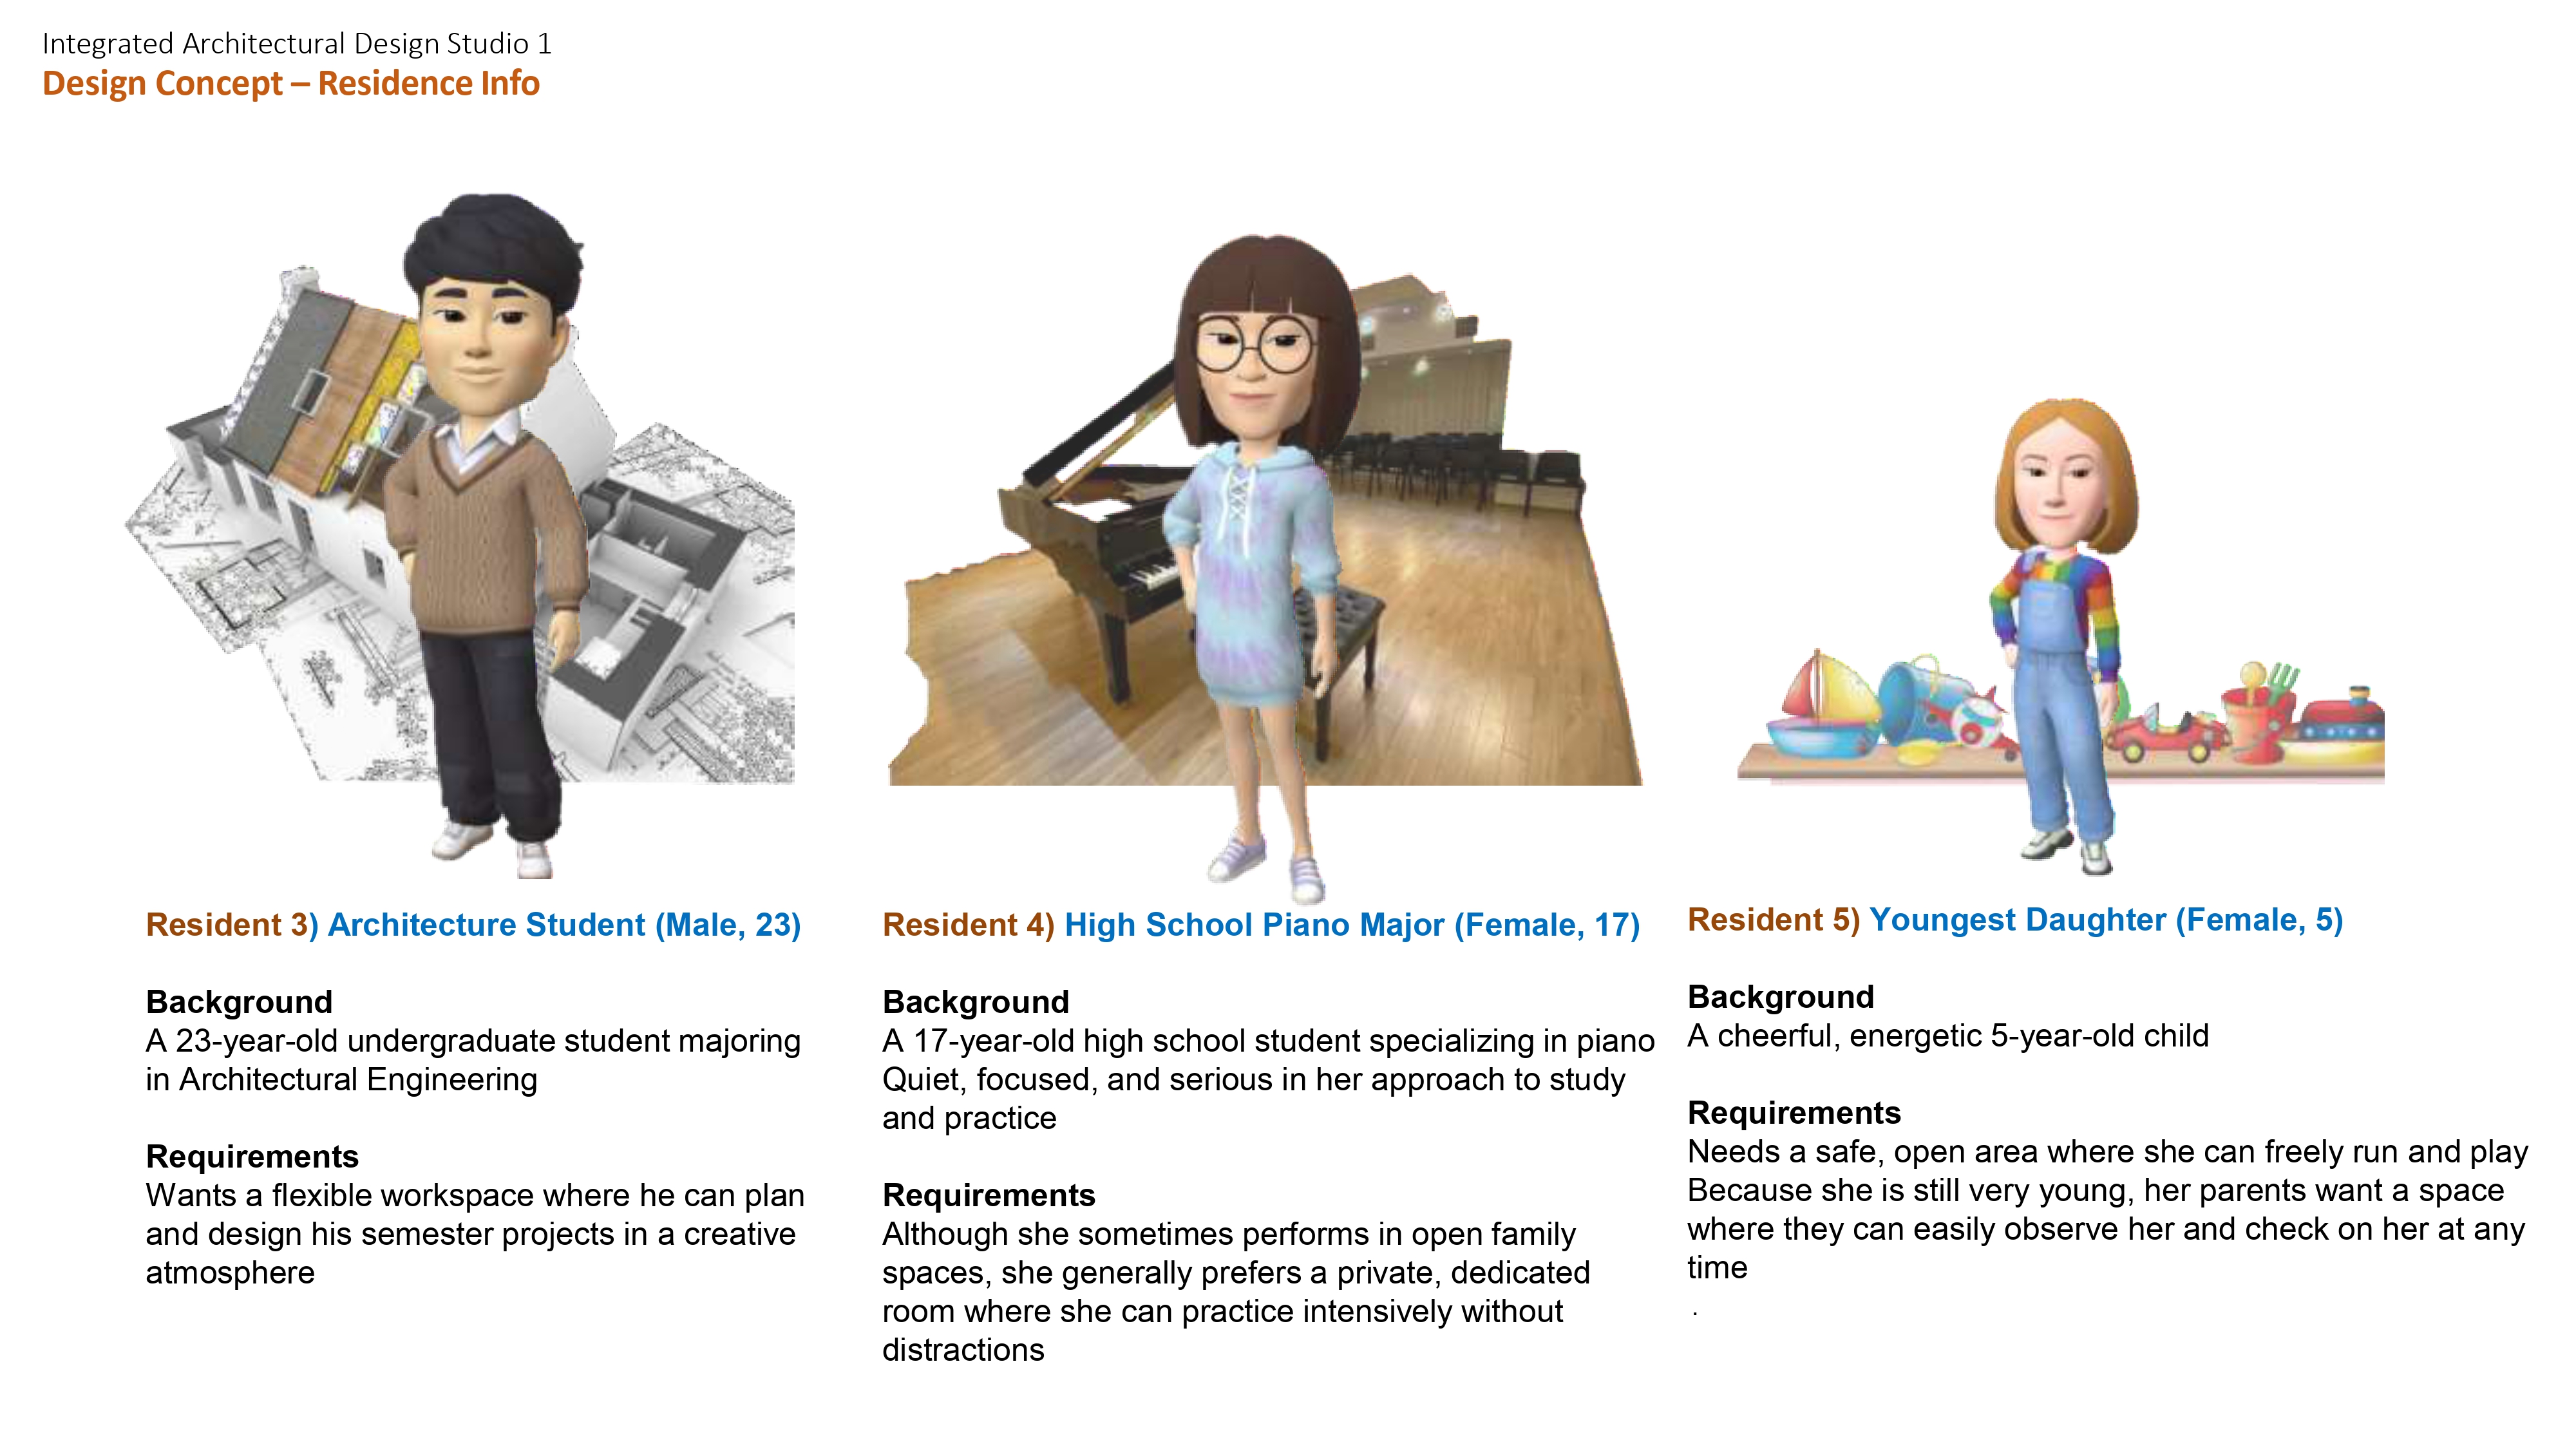
- Residence Information
- Room Arrangement Strategy
Full slide summarizing the design concept:


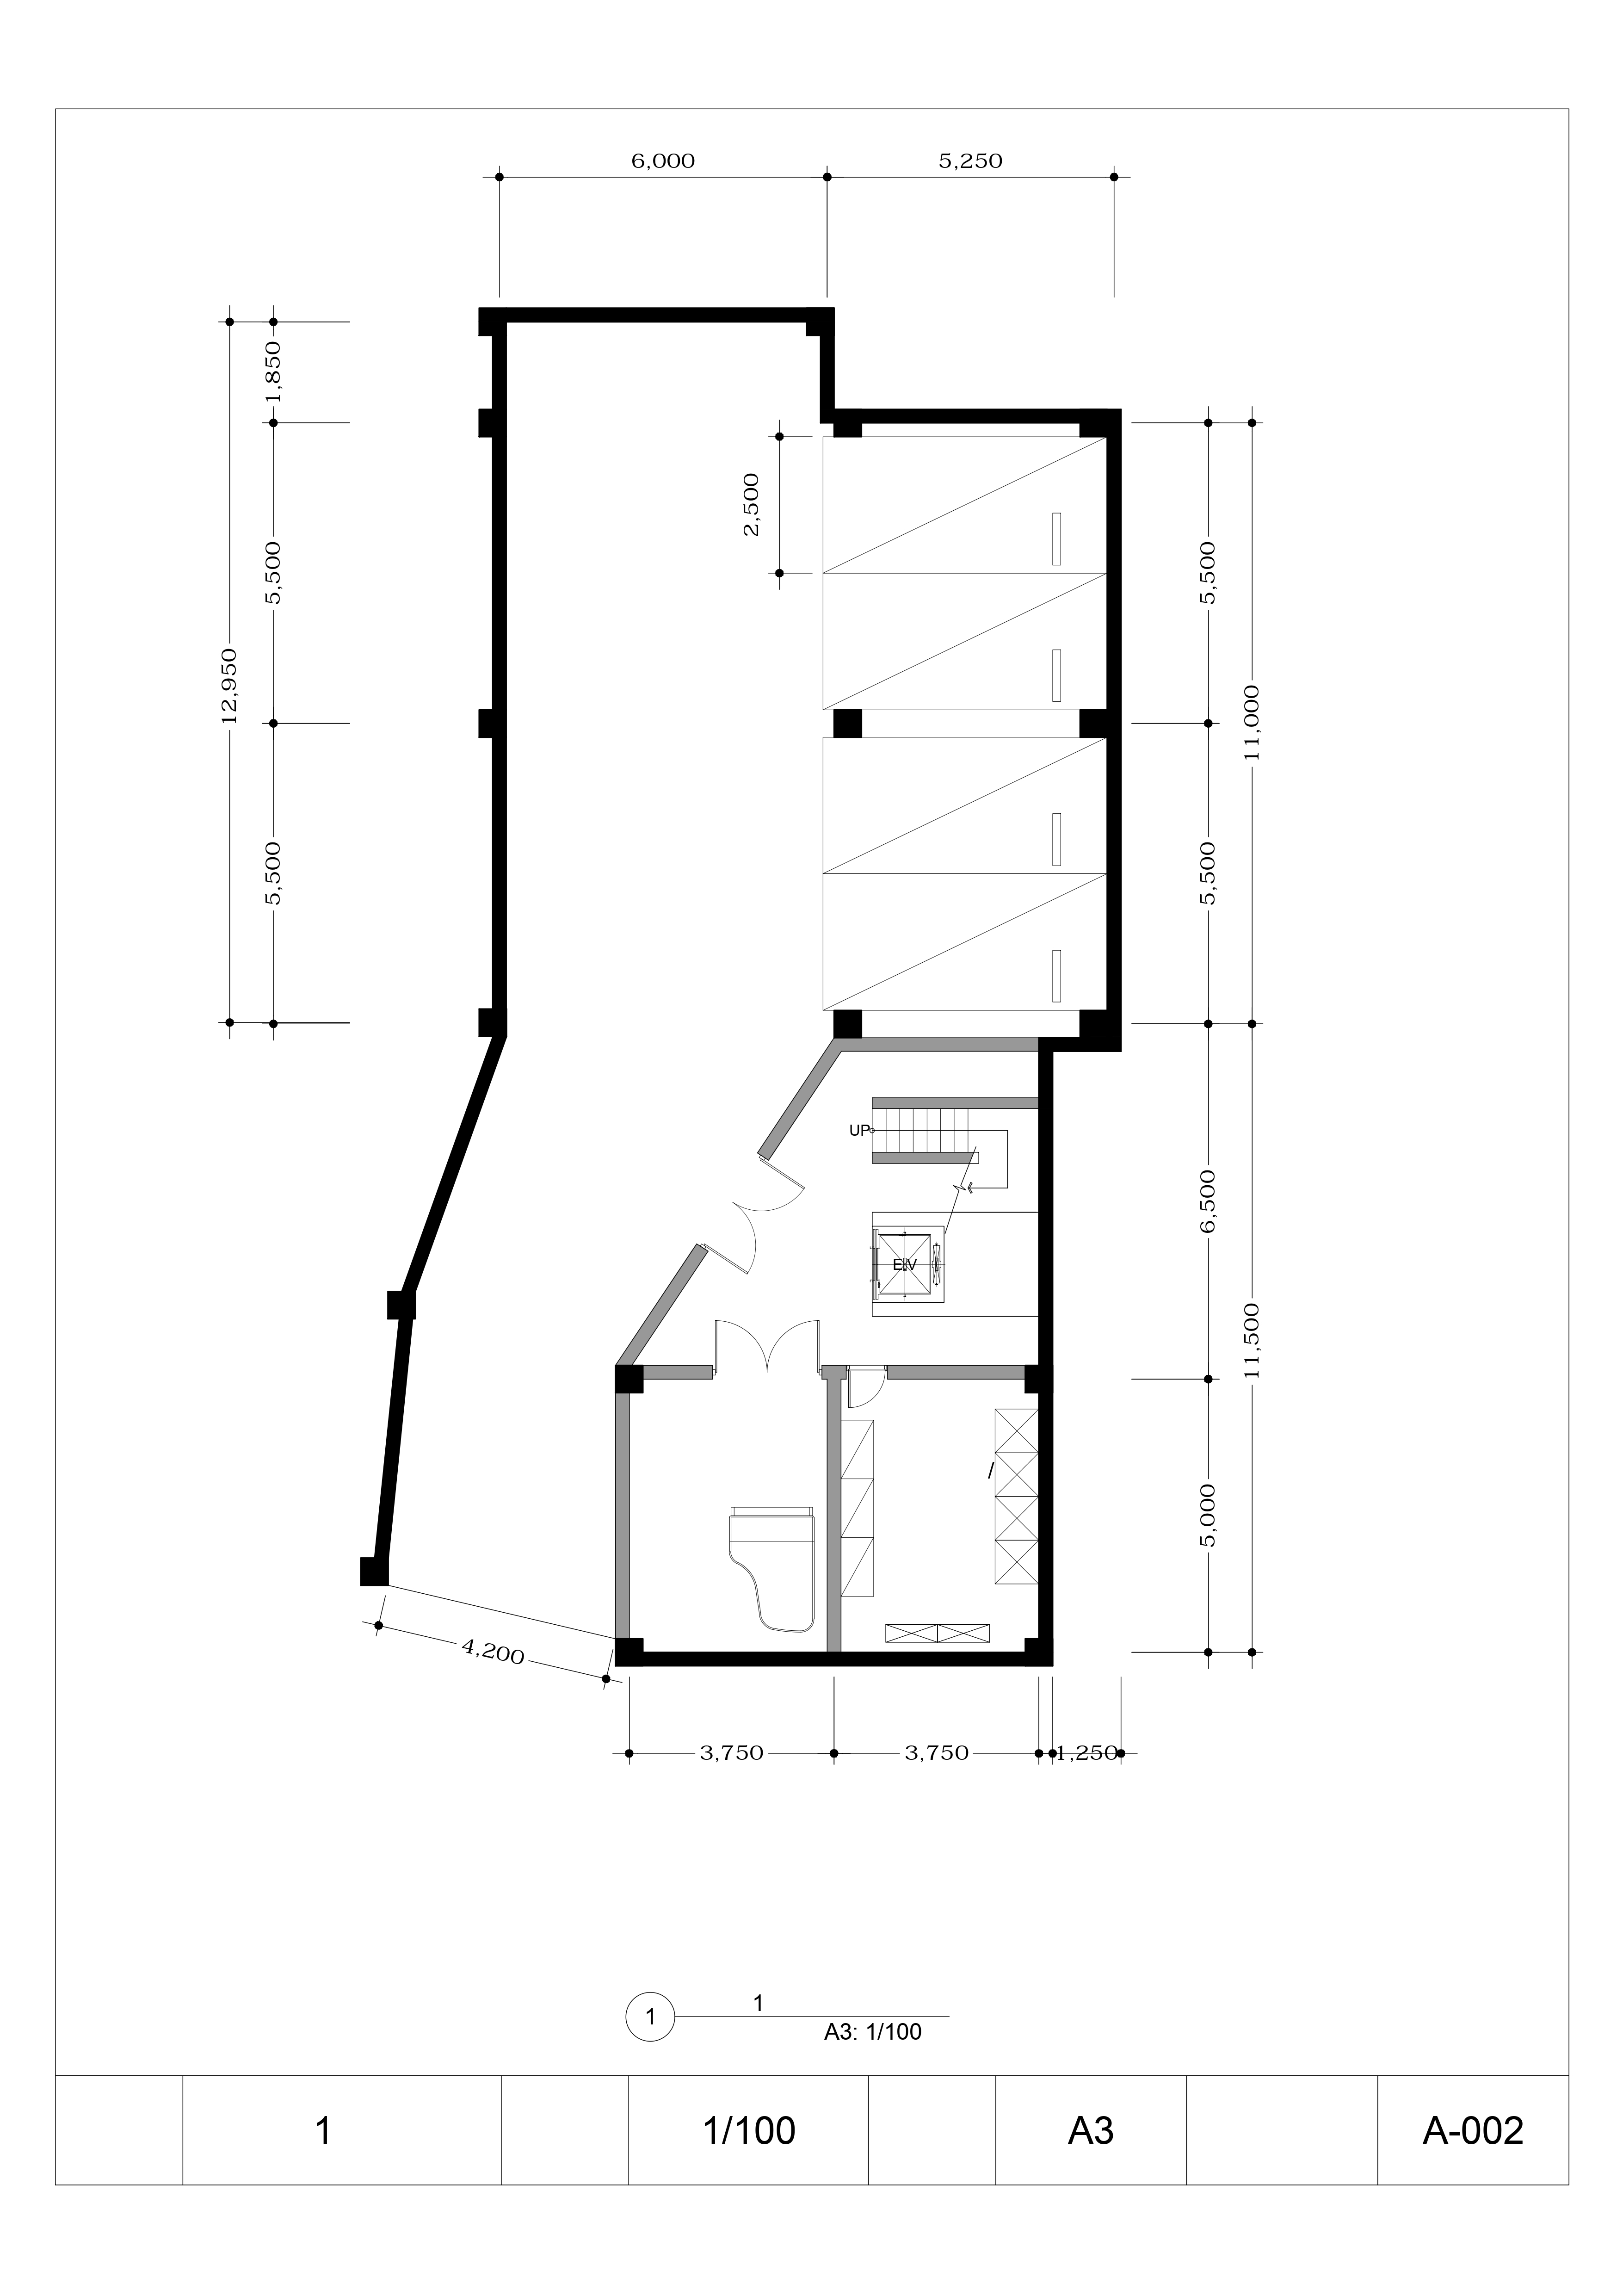
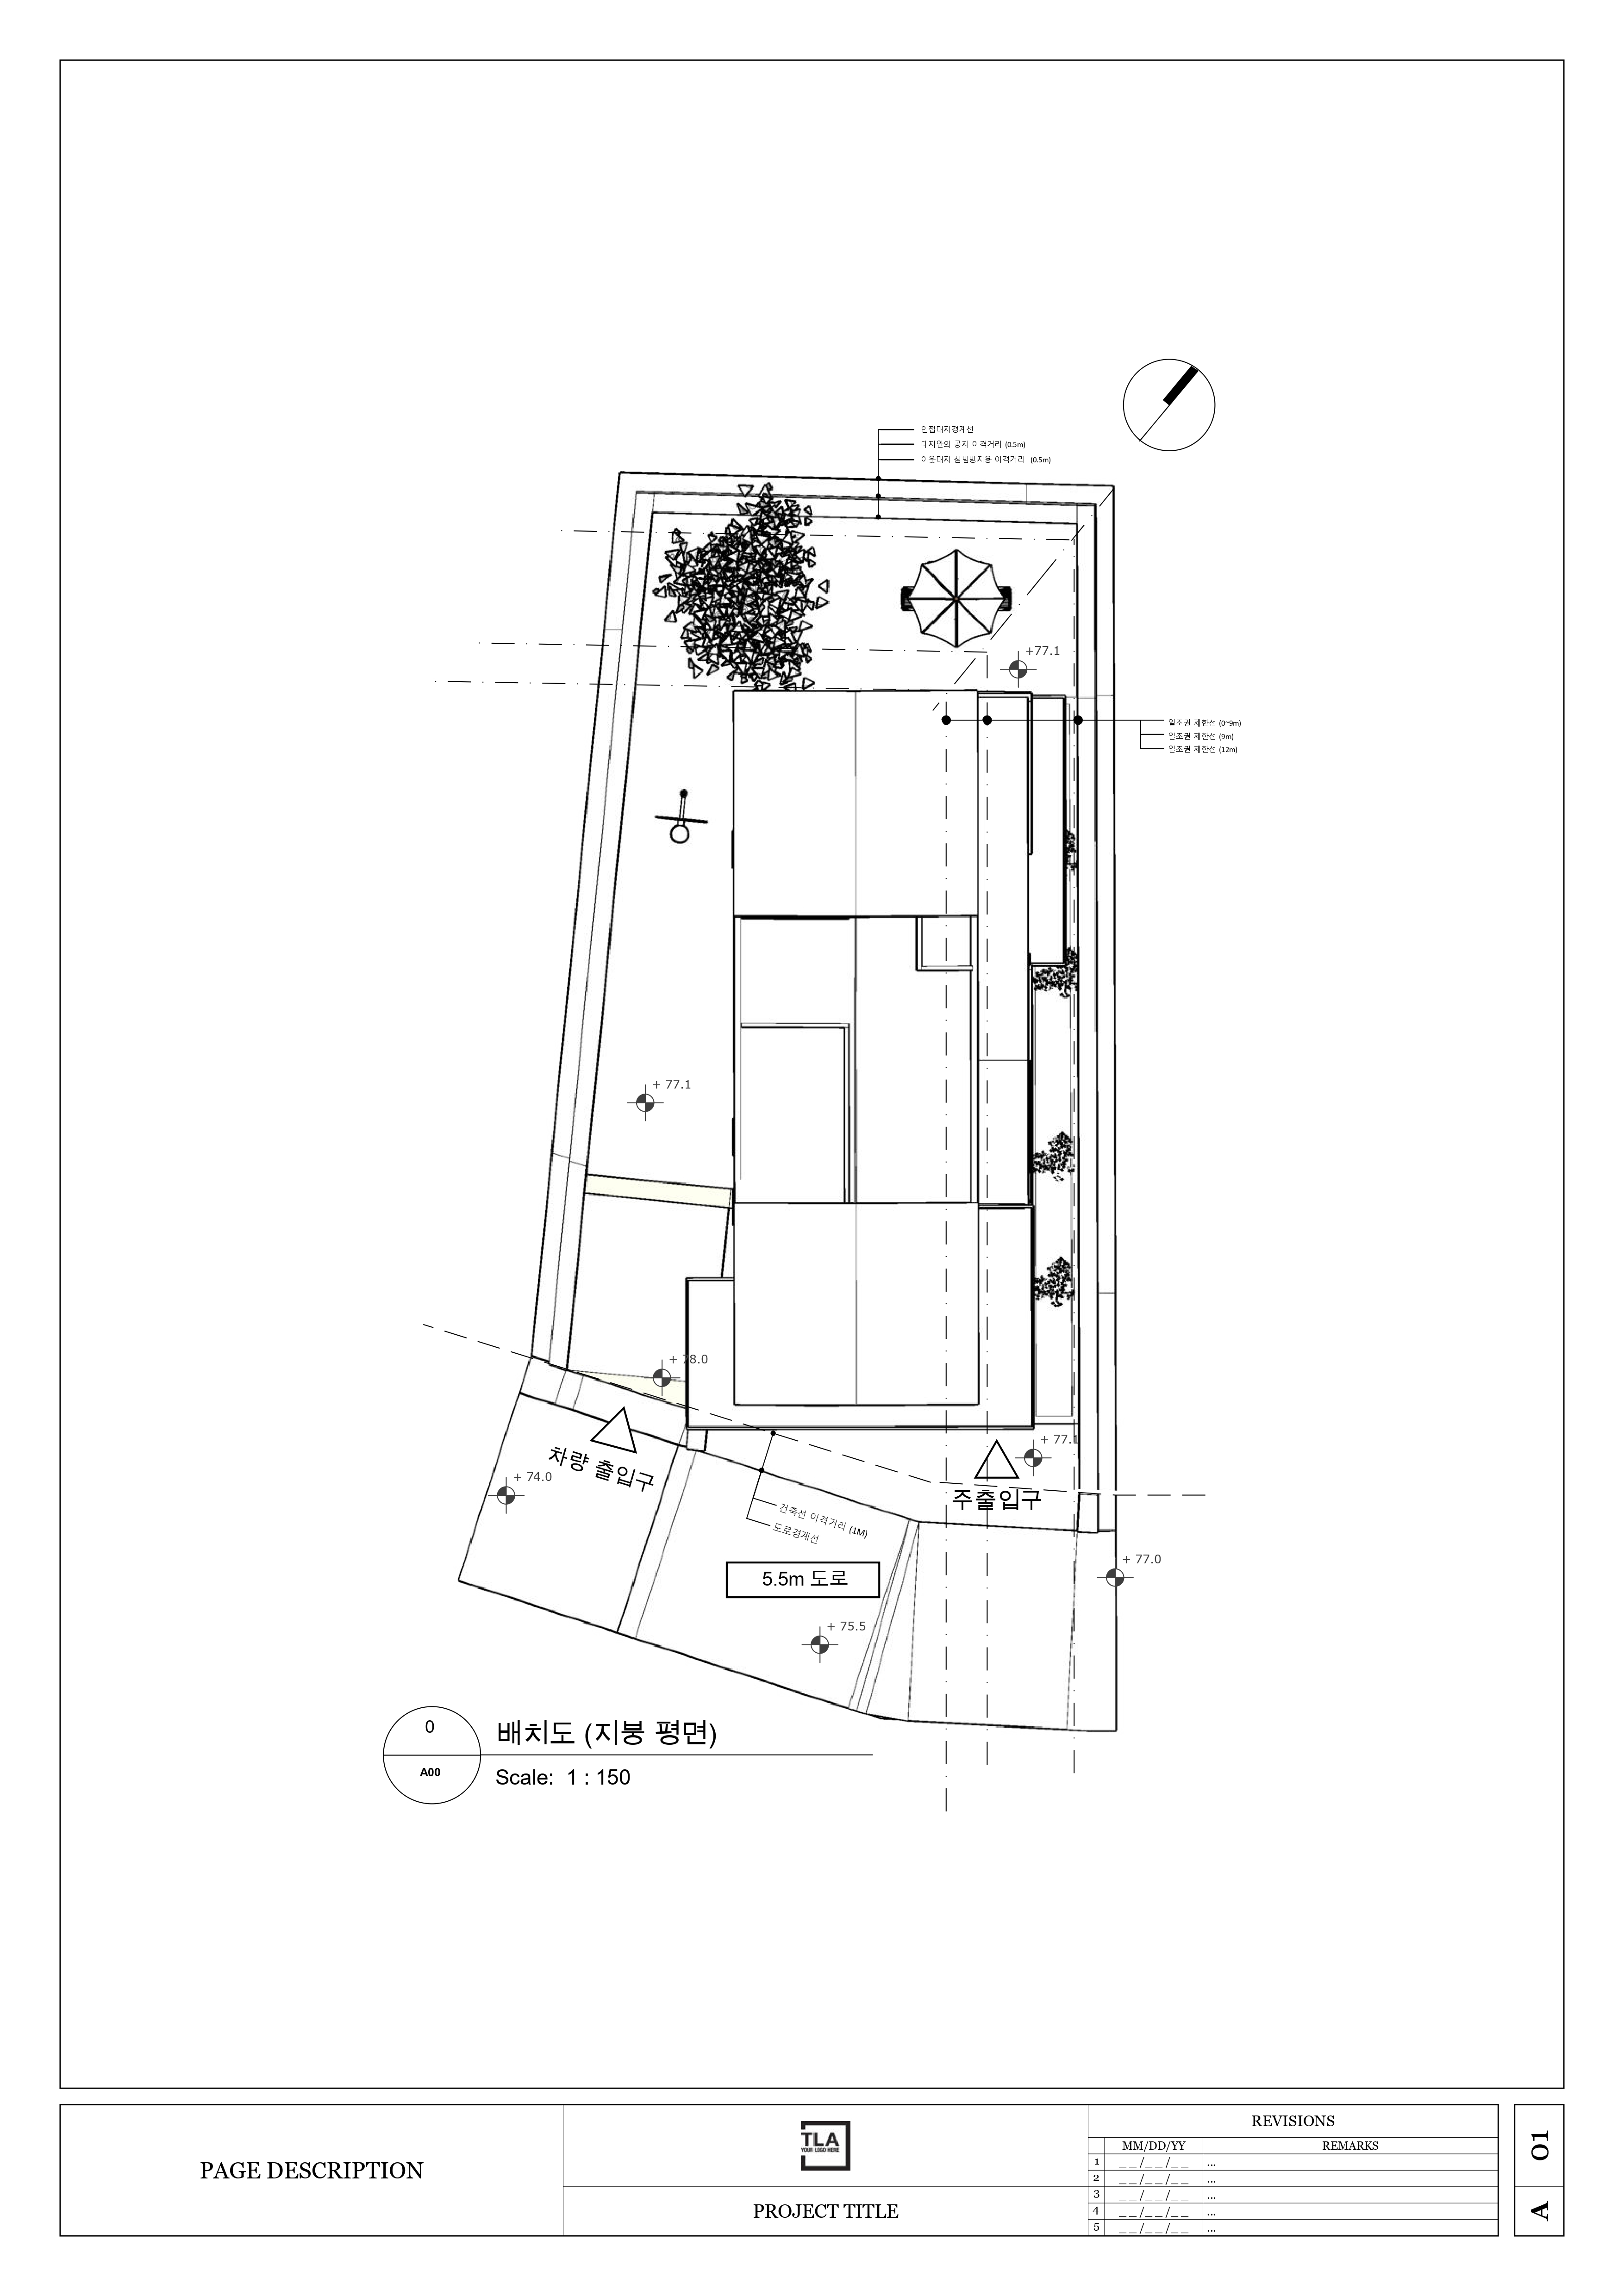
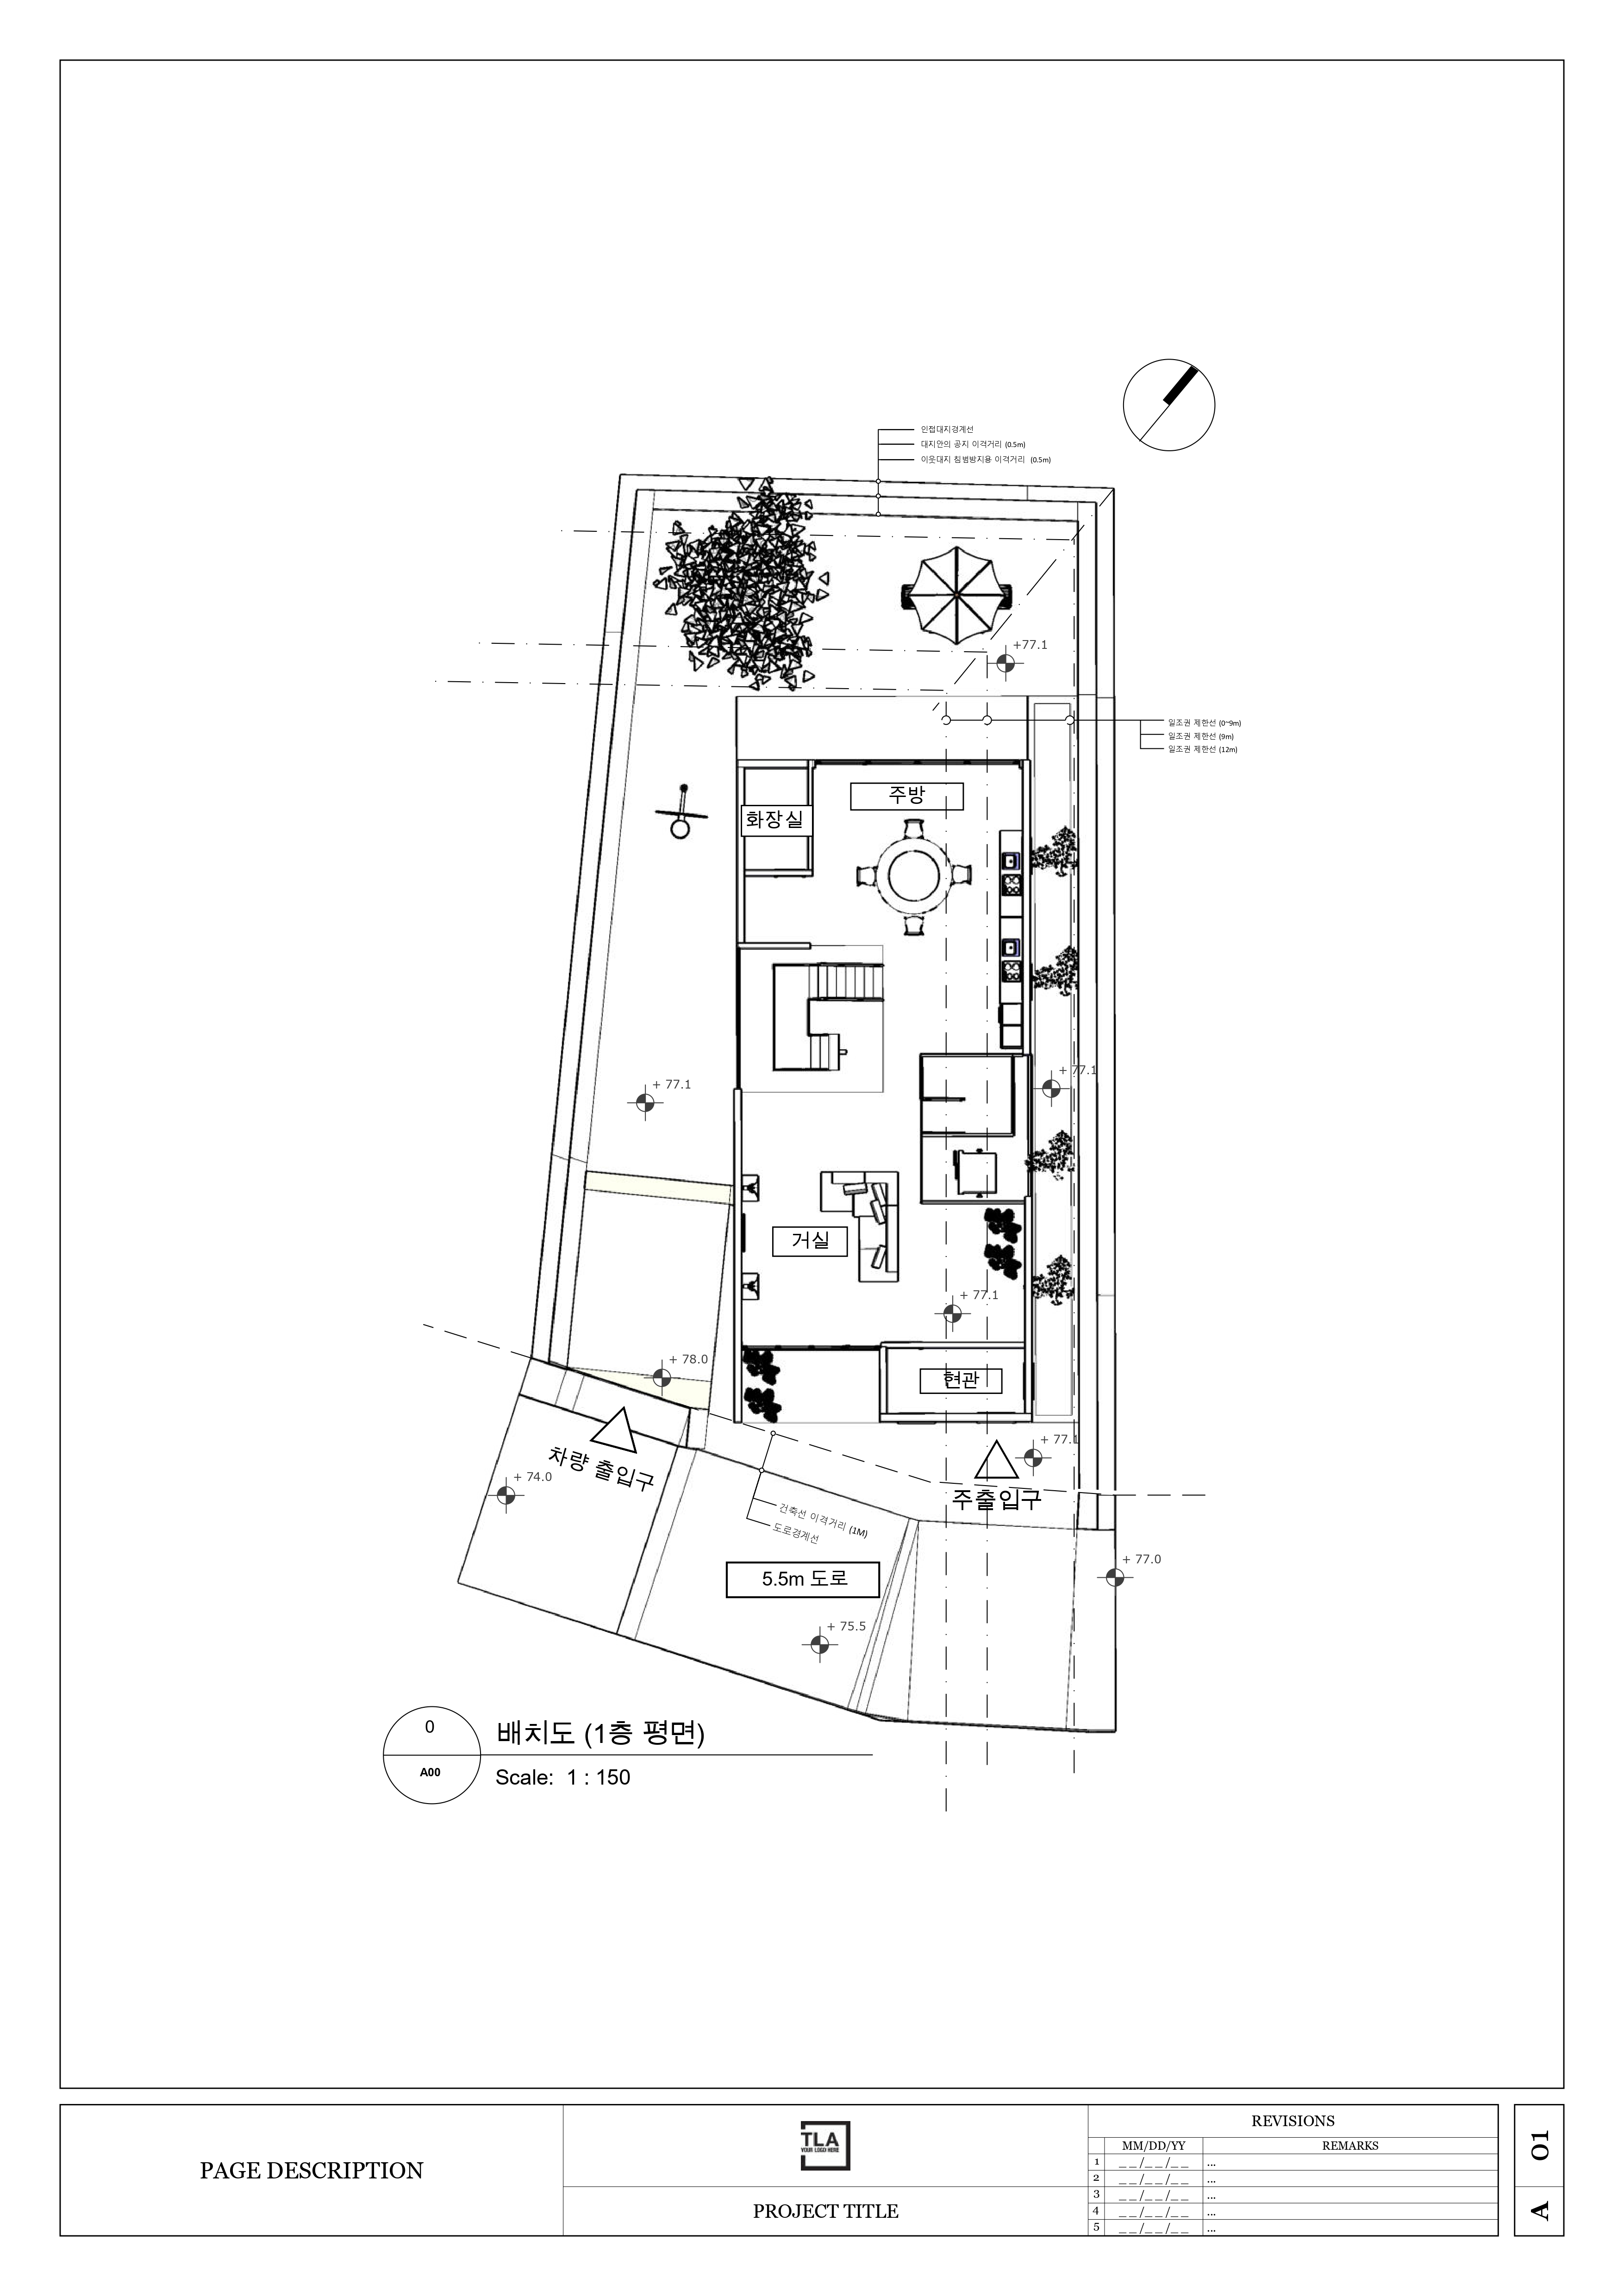
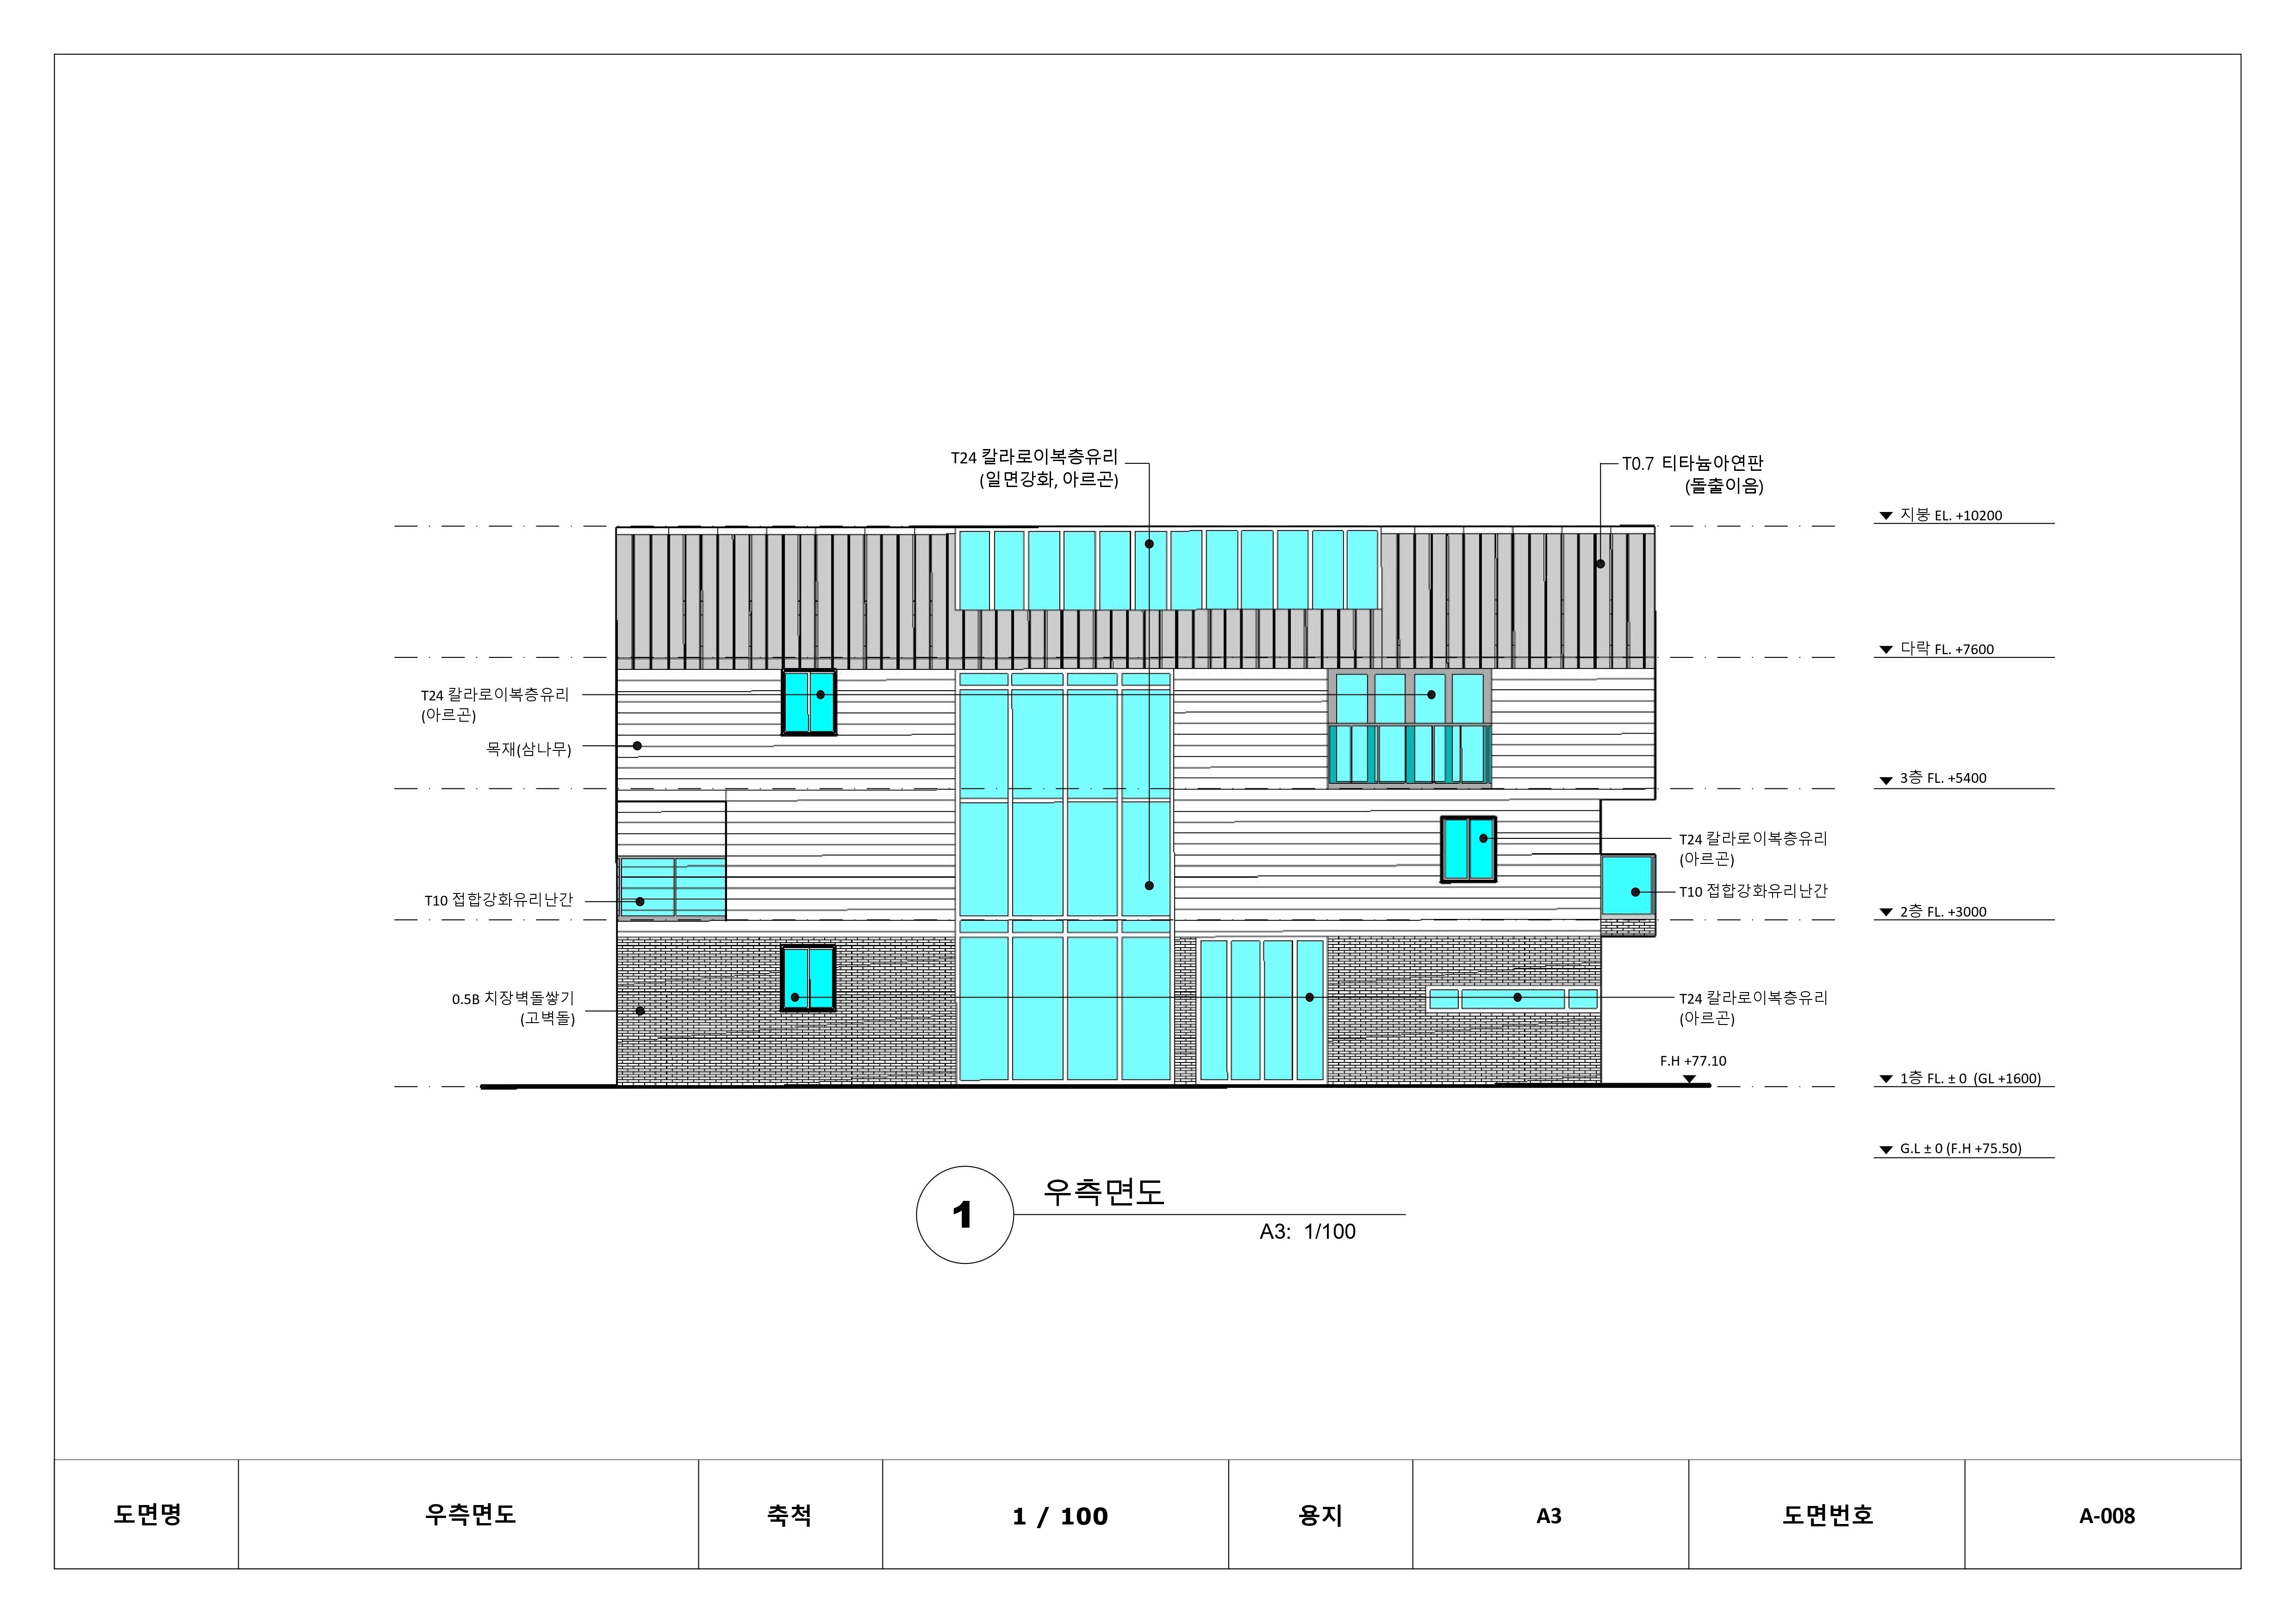
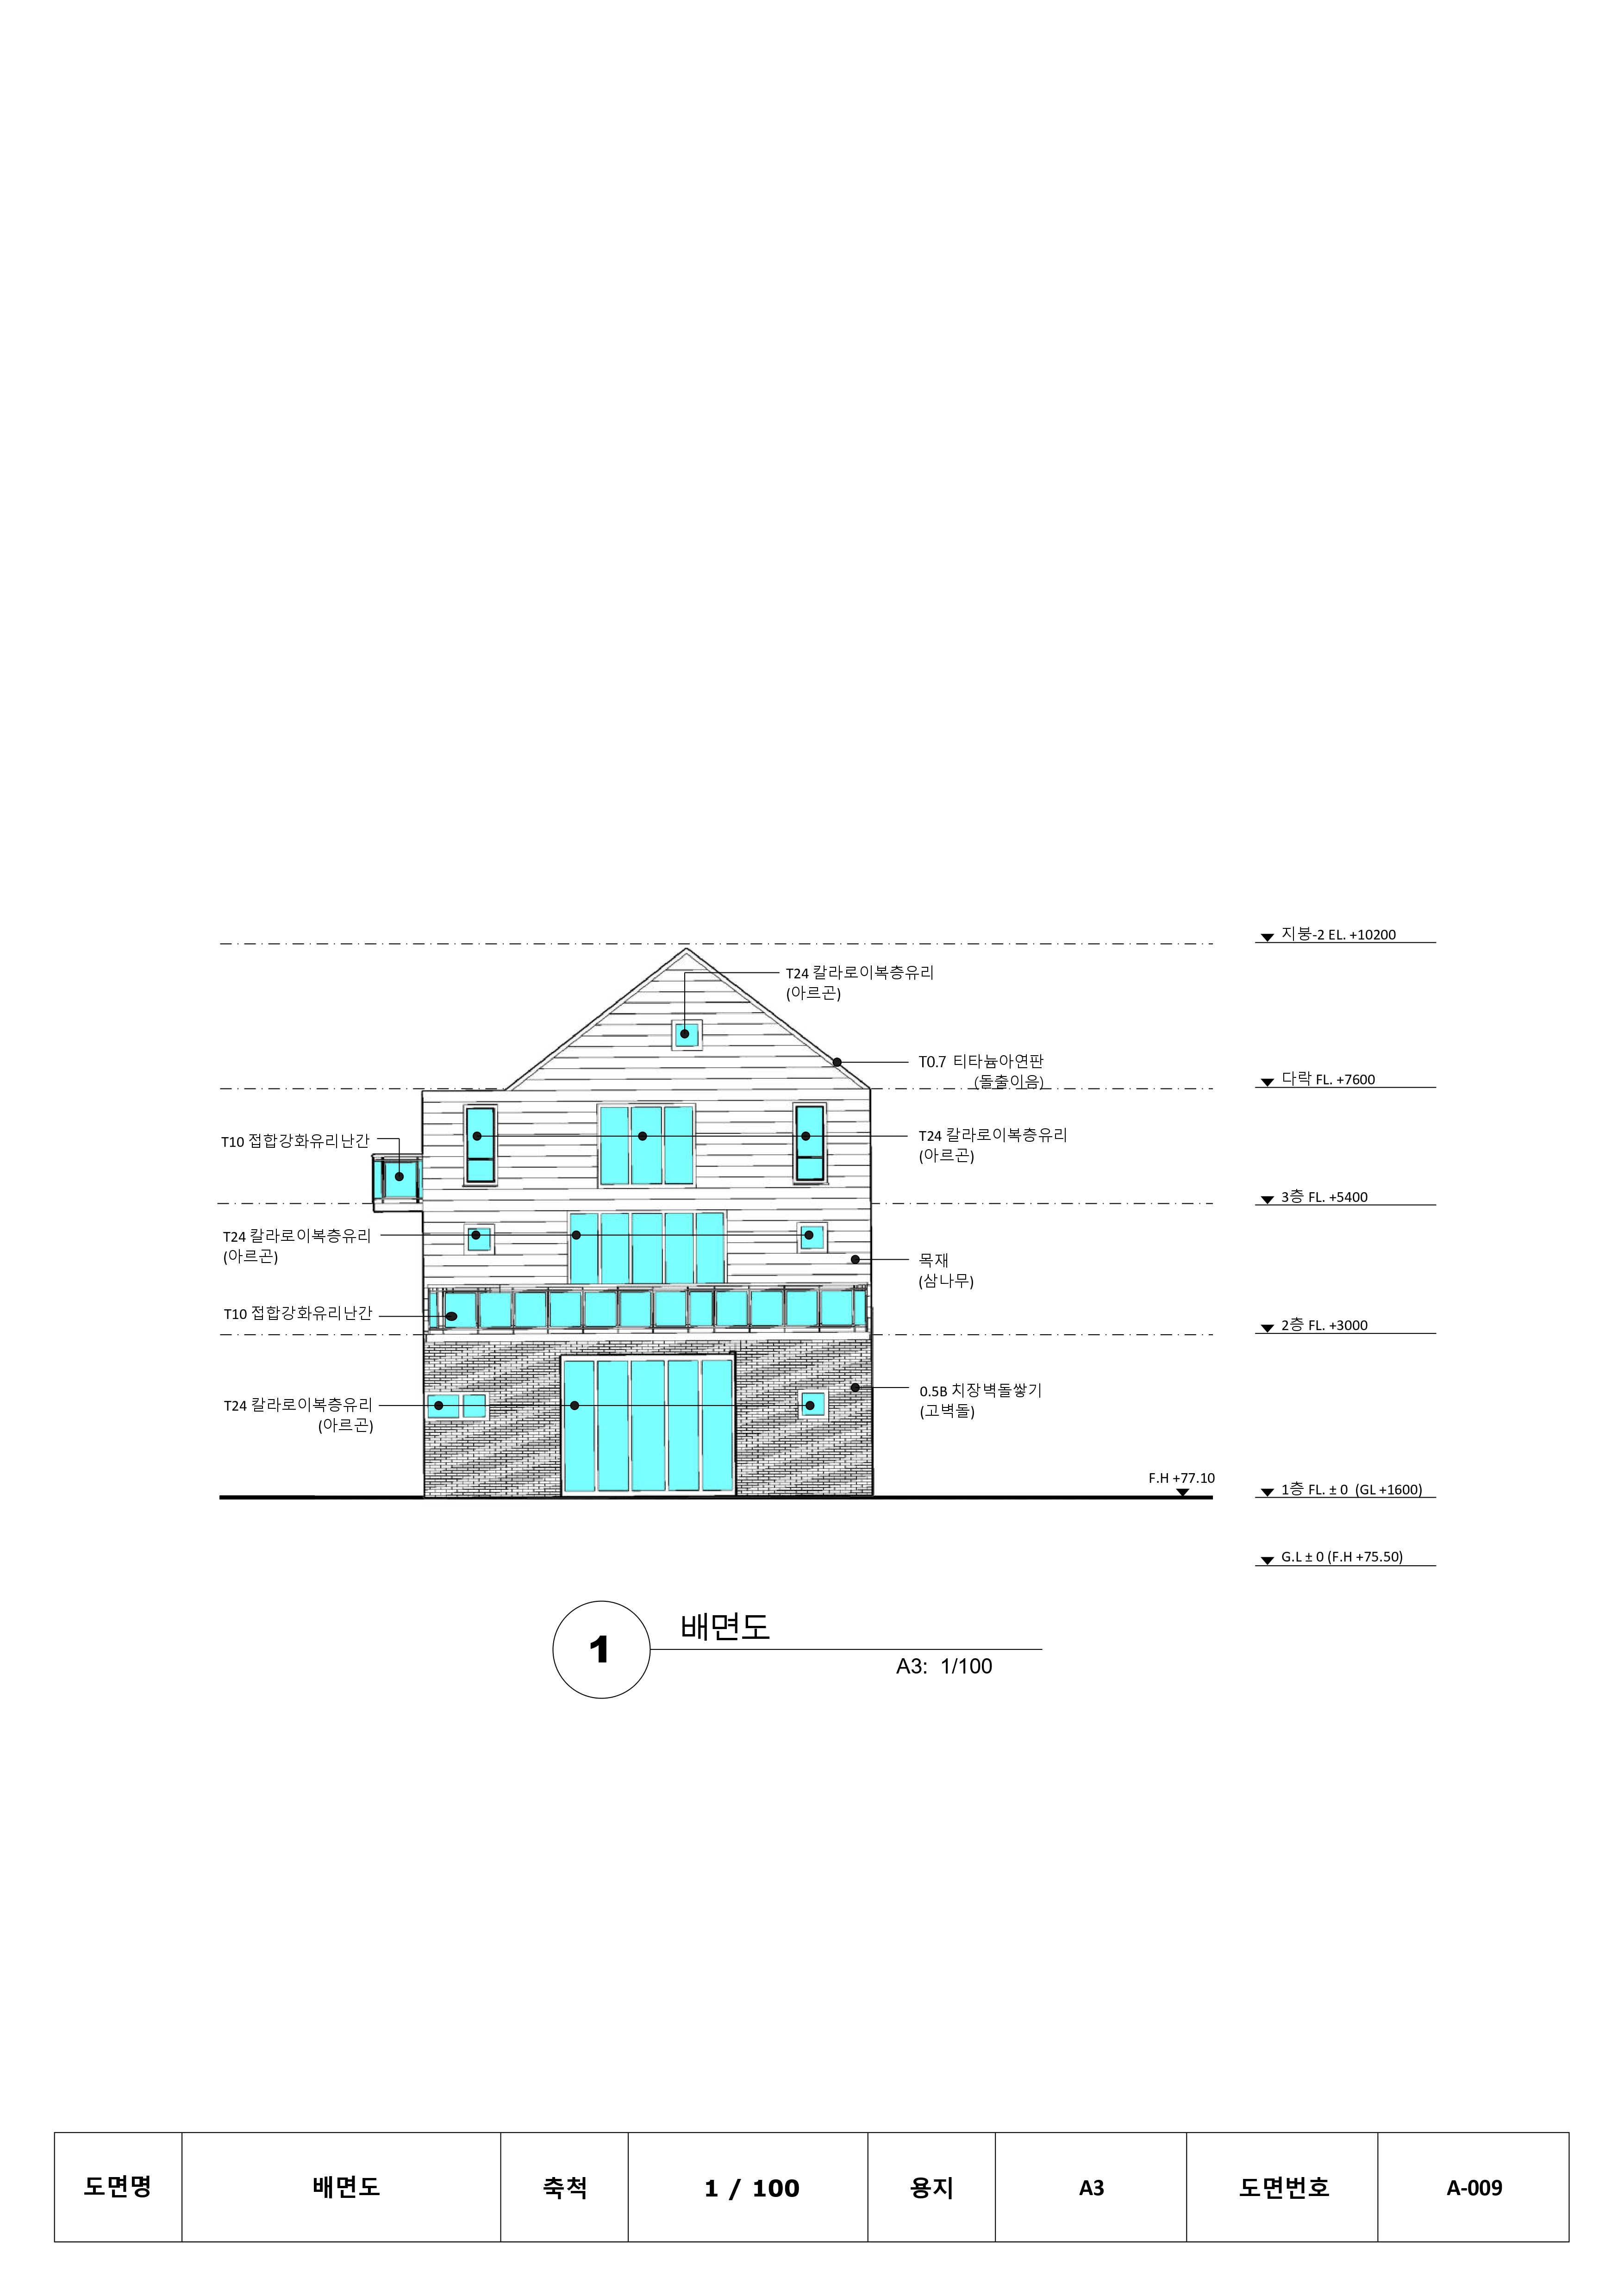
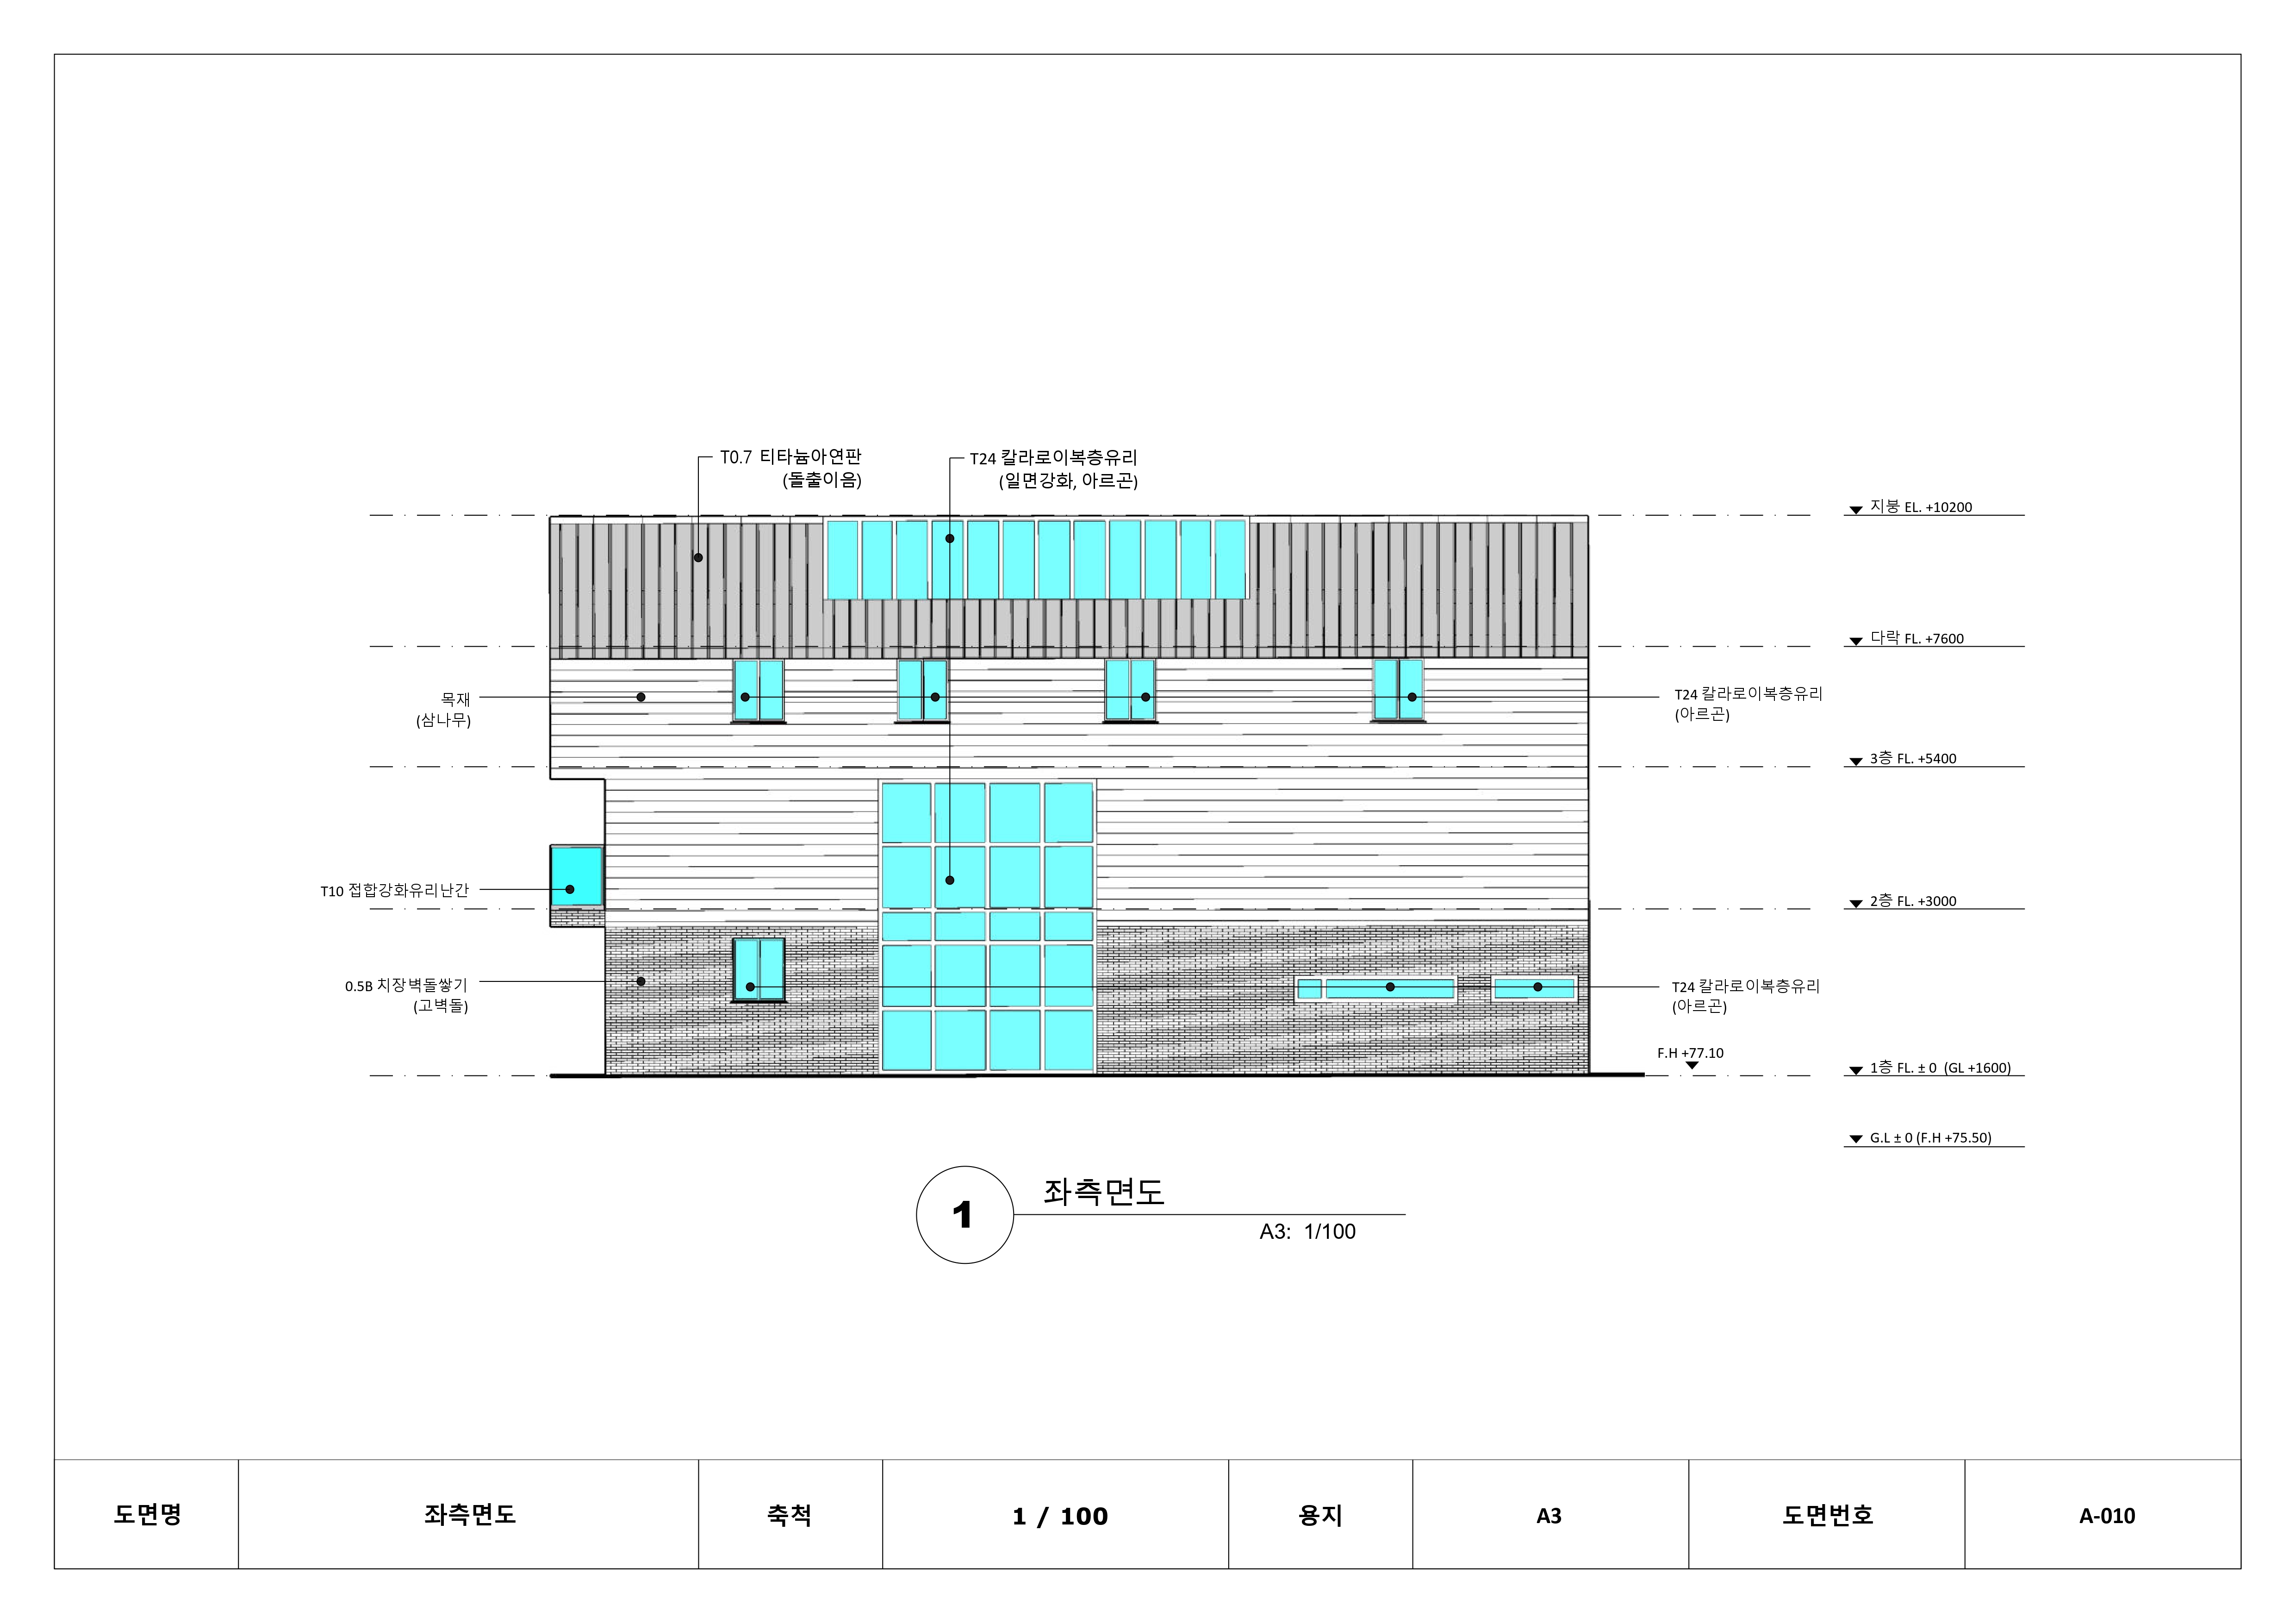
③ Drawings (Written in Korean)
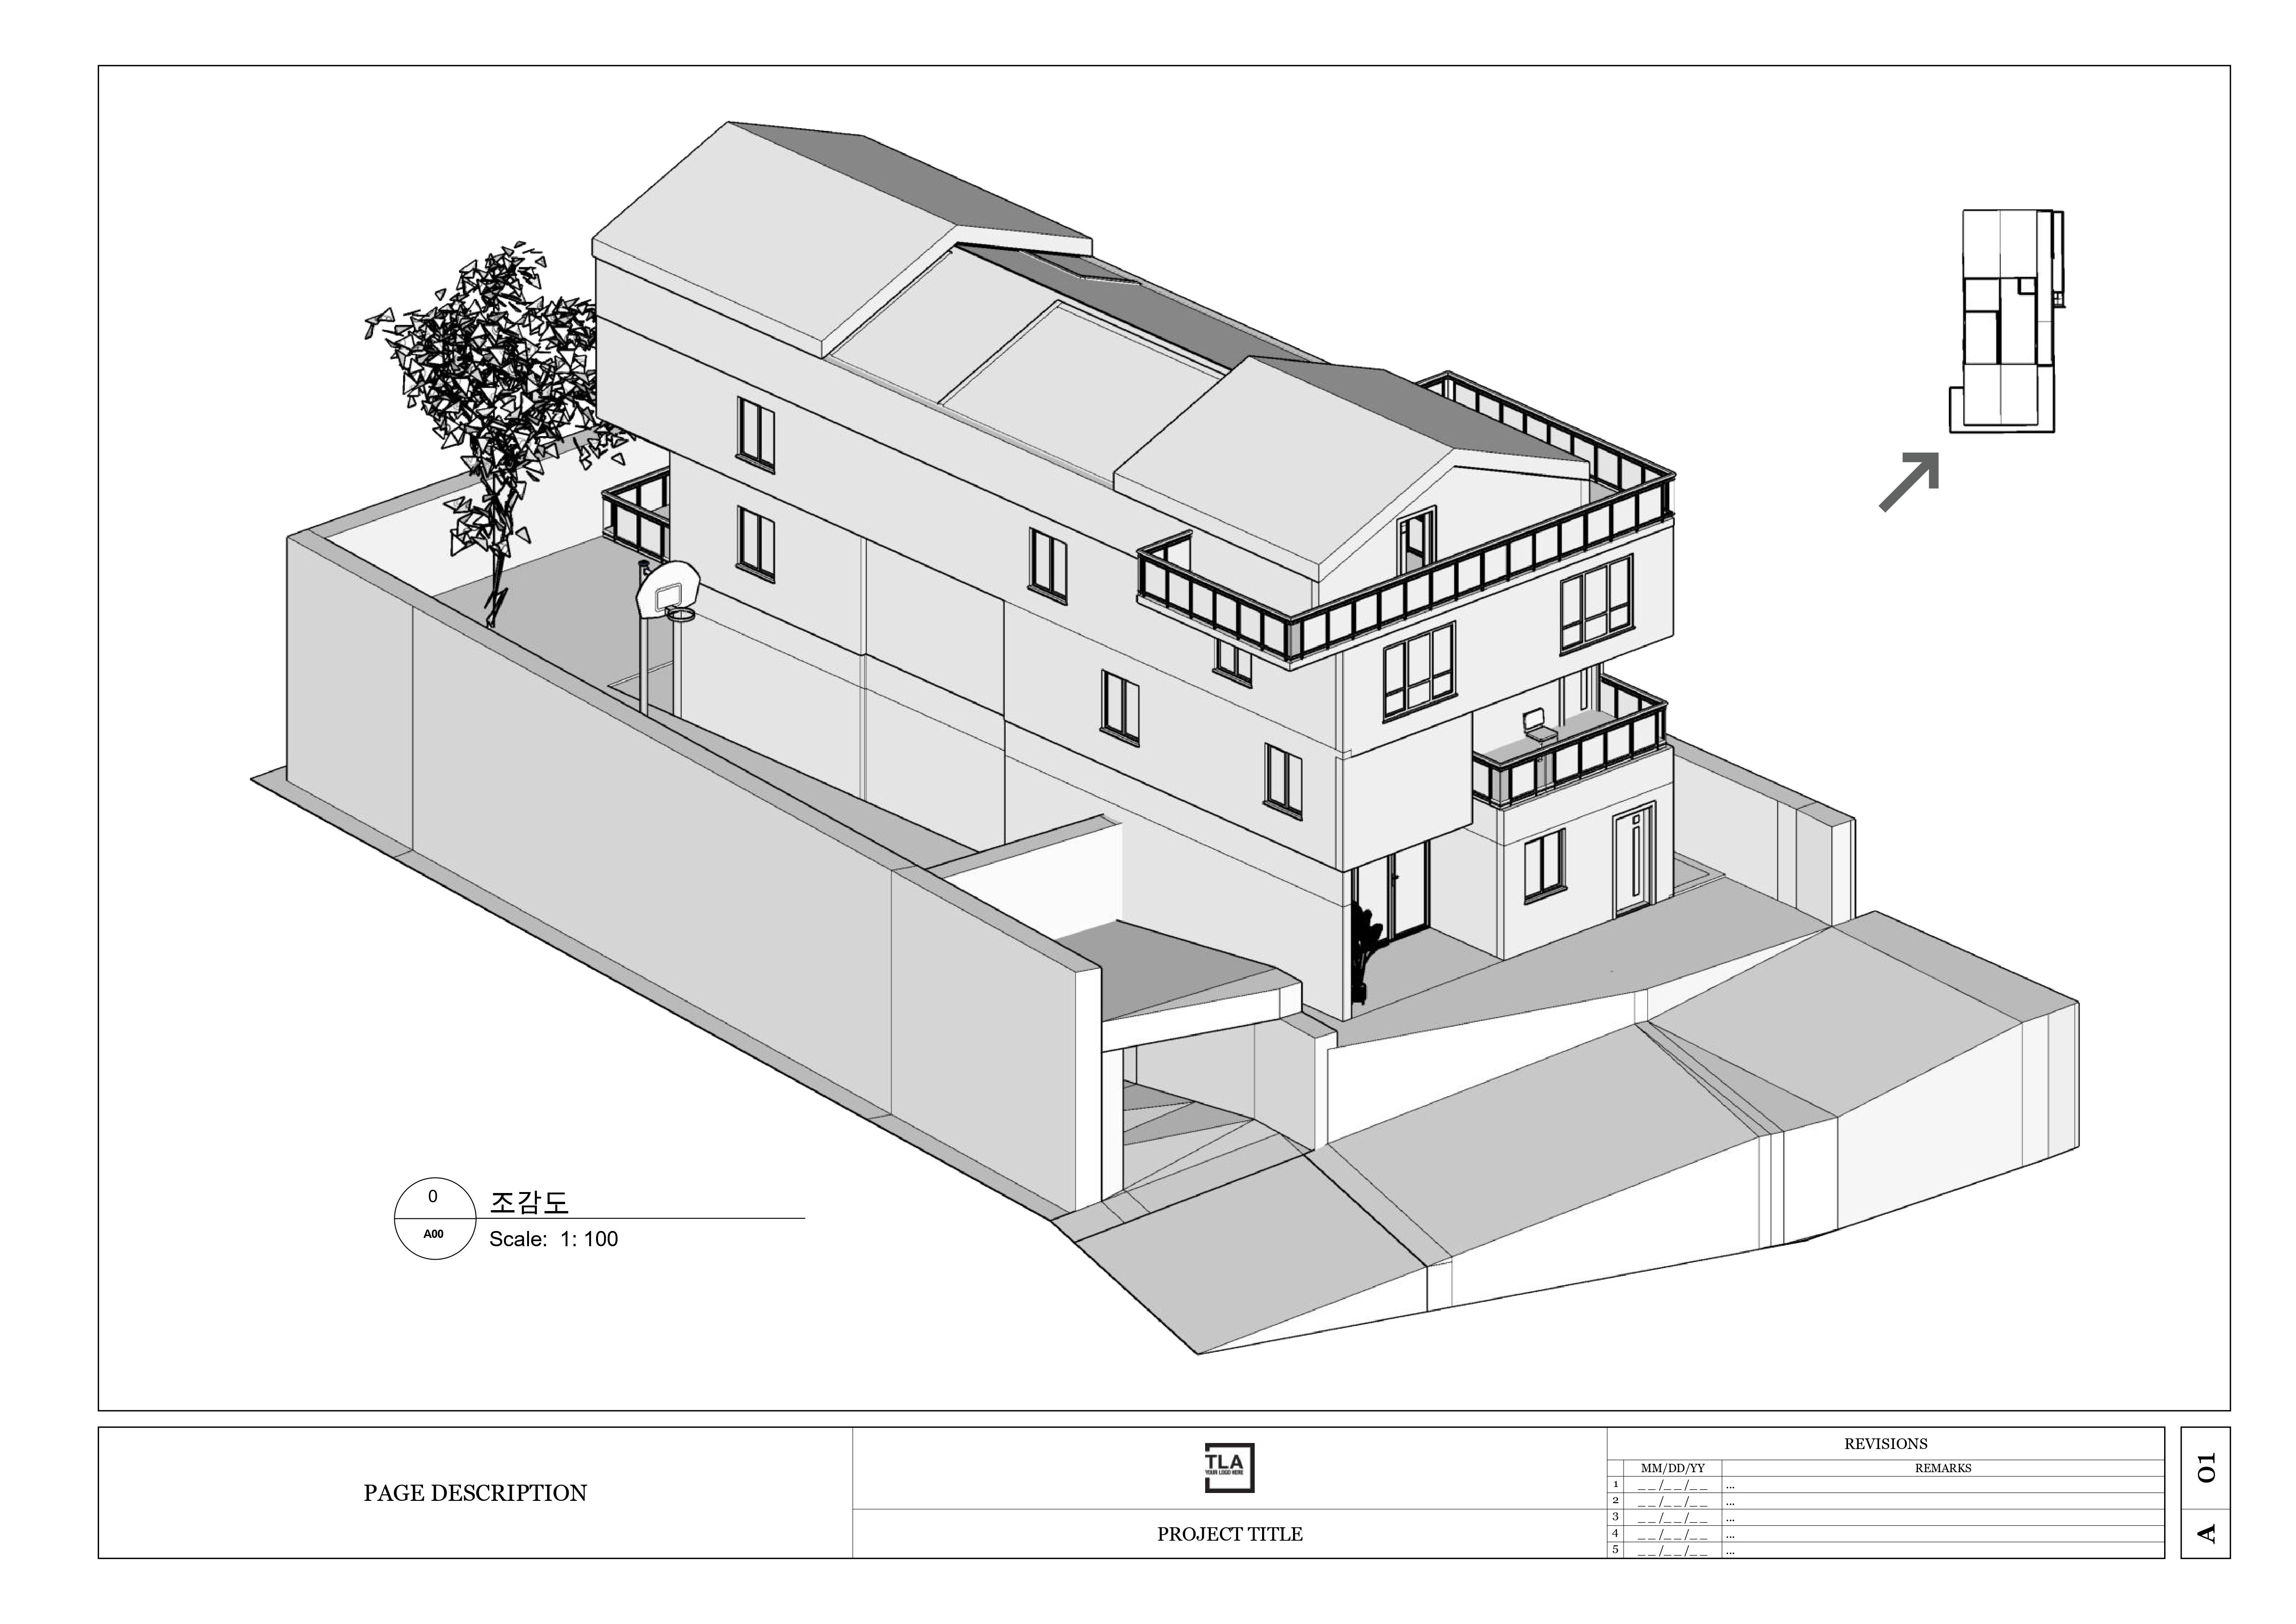
This section presents the complete architectural drawing set, including plans, elevations, and sections that illustrate the spatial configuration and formal resolution of the project.
- Site Plan
- Floor Plans
- Front Elevation
- Right Elevation
- Rear Elevation
- Left Elevation
- Bird’s-eye & Perspective Views